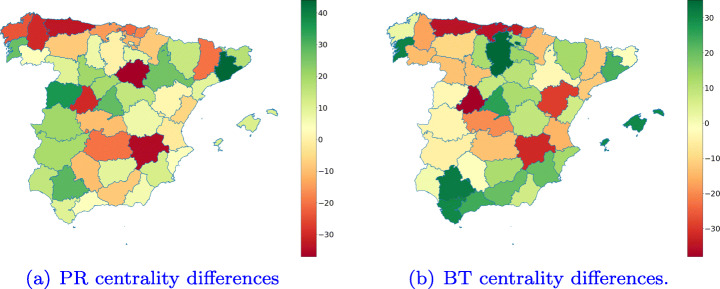
Fig. 12.
Differences among Spanish provinces based on its PR and BT centrality measurements from the INE and TWT graphs. Red provinces are those whose position in the TWT ranking was higher than in the INE one. On the contrary, the green ones are provinces whose position in the INE ranking was higher than in the TWT one

