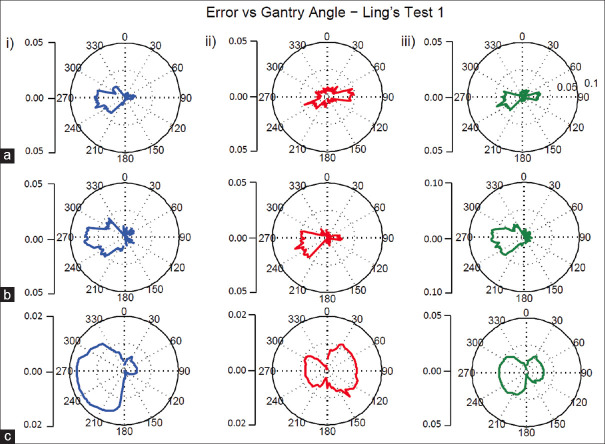
Figure 1.
Polar plots of the error (mm) versus the gantry angle of multiple treatment machines and leaf banks. Polar plot of the error (mm) in the radial component that has been averaged over 2° control points, versus the gantry angle (IEC convention) for (a) iX-1 (13 tests) (b) Tri-1 (14 tests) and (c) True 1 (732 tests). This was further split into the error present on (i) bank A, (ii) bank B, and (iii) the leaf gap width. Please note the different scales present on the polar plots. These graphs serve to help us understand the error distribution for each individual bank of each machine

