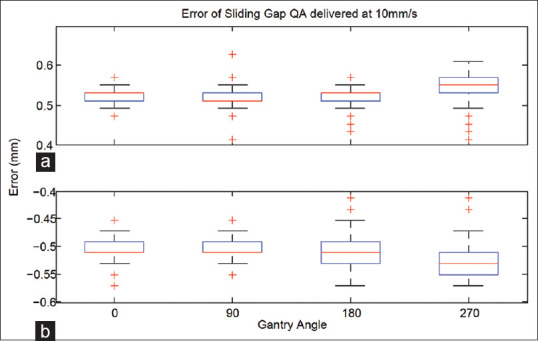
Figure 2.

Box and whisker plots of the multileaf collimator error of Sliding Gap QA (10 mm/s) performed at cardinal gantry angles. The error (mm) for sliding gap QA delivered at four different gantry angles on iX-2 for (a) bank A, and (b) bank B. Leaves moved with velocity 10 mm/s. The box and whisker plot represents the data as follows: The top line (or whisker) is the maximum value, the next line is the 3rd quartile, the red line is the median, the next line is the 1st quartile, and the last line is the minimum value. The red crosses are outliers
