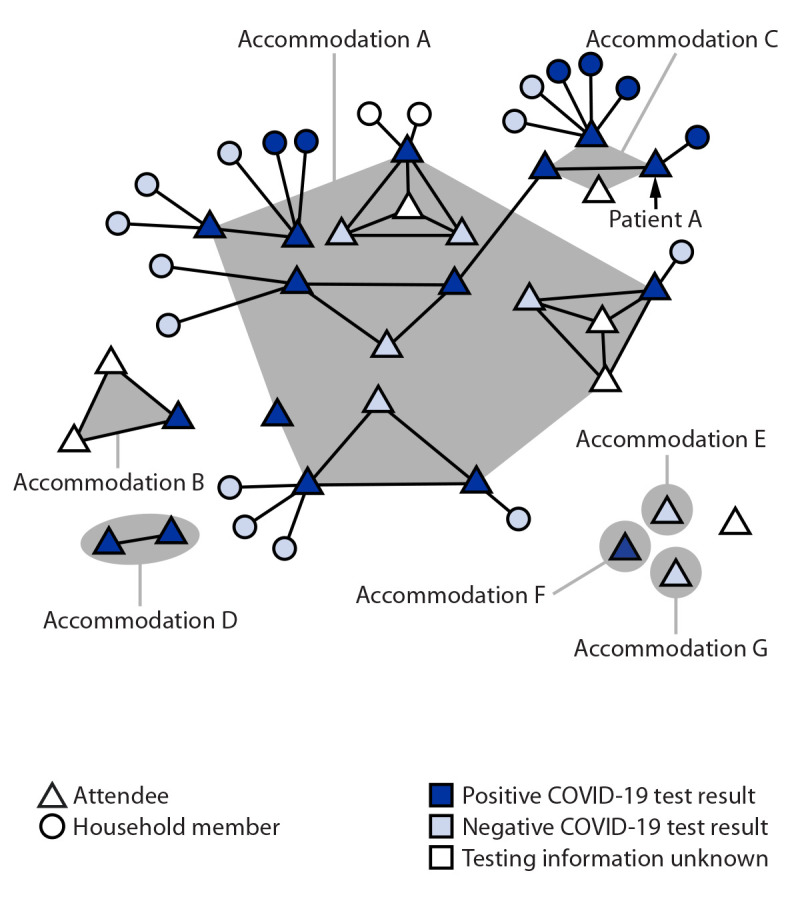
FIGURE.

SARS-CoV-2 infections among a cluster of attendees of a New York City convention, by accommodation while in New York City and forward household transmission — 13 states,* November 18–December 20, 2021†
* Arizona, California, Connecticut, Maryland, Massachusetts, Michigan, Minnesota, Missouri, New Jersey, New York, North Carolina, Texas, and Virginia.
† This figure was produced using MicrobeTrace. https://pubmed.ncbi.nlm.nih.gov/34492010/
