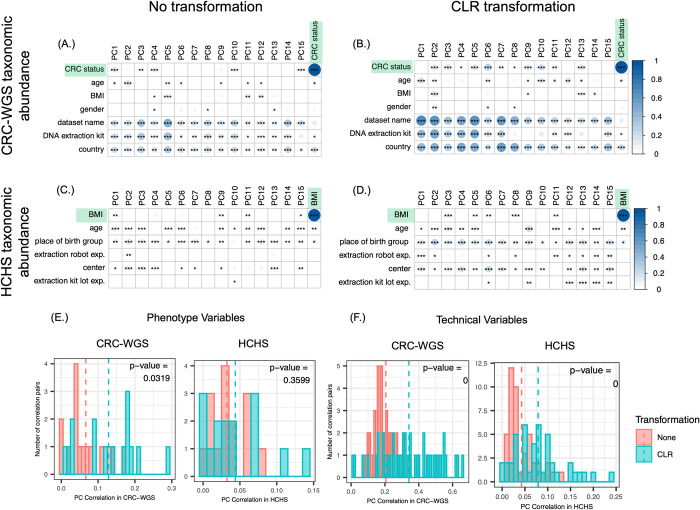
Fig 2. Microbiome data is affected by technical and biological variables.
(A-D) Heatmaps of canonical correlations between the first 15 PCs and study covariates in CRC-WGS with (A) no transformation and (B) after CLR transformation; and in HCHS with (C) no transformation and (D) after CLR transformation. (E,F) Histograms of the correlations in (A-D) where the distributions were compared using a paired Wilcoxon signed-rank test to test whether the distribution of correlations from PCs of CLR-transformed are greater than the untransformed. The size and color of the circles in each cell in A-D indicate the magnitude of correlation and black asterisks indicate the significance of the Pearson correlation of the PCs with each of the variables. The color bar at right represents the range of correlations observed across all datasets. [*,**,*** indicate Wilcoxon signed-rank p-values as follows: 10−2 < p < 0.05, 10−3 < p < 10−2, p < 10−3]. See S2 and S5 Figs for similar analyses for the other datasets, and S6 Fig for other transformations.

