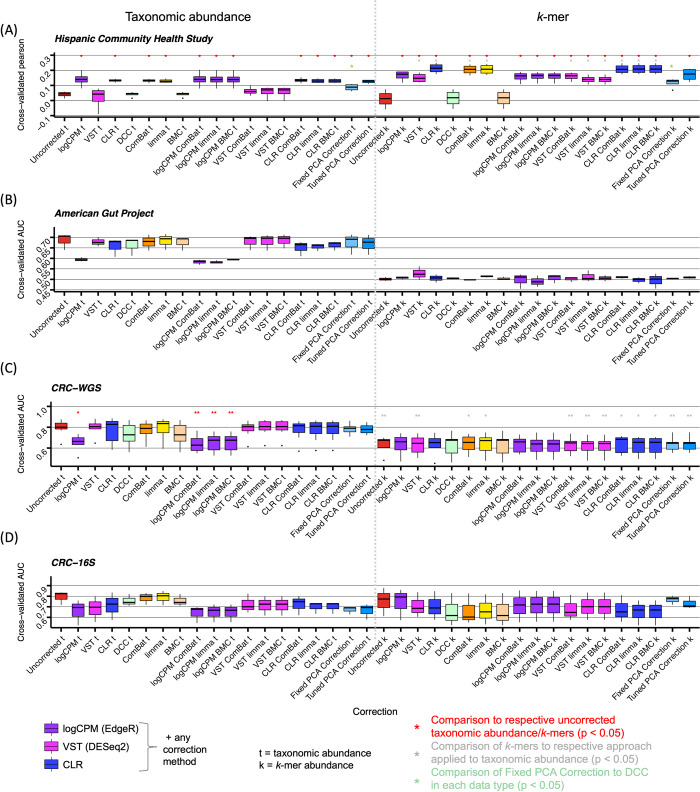
Fig 4. Phenotype prediction models generalize across studies after application of noise correction methods.
Cross-study prediction of (A) body mass index (BMI) in the HCHS dataset across different extraction robots (B) antibiotic consumption in the past year in the AGP dataset across different Illumina sequencing models, (C) CRC status in the CRC-WGS dataset across different studies and (D) CRC status in the CRC-16S dataset across different studies. The boxplots in (A) indicate leave-one-dataset-out Pearson correlation between true and predicted BMI, for each batch. (B-D) indicate leave-one-dataset-out AUC for each held-out study or batch. p-values comparing each boxplot were computed using a one-sided Wilcoxon signed-rank test. A red * indicates a significant difference in prediction ability compared to uncorrected data in the respective taxonomic or k-mer group. A grey * indicates a significant difference in prediction between the k-mer (k) and taxonomic abundance (t) groups for a given approach. A green * indicates a significant difference in prediction between the Fixed PCA correction and DCC for a given data type. Due to the low number of folds in LODO prediction (3 to 7 values per box plot), many tests did not yield a p-value.

