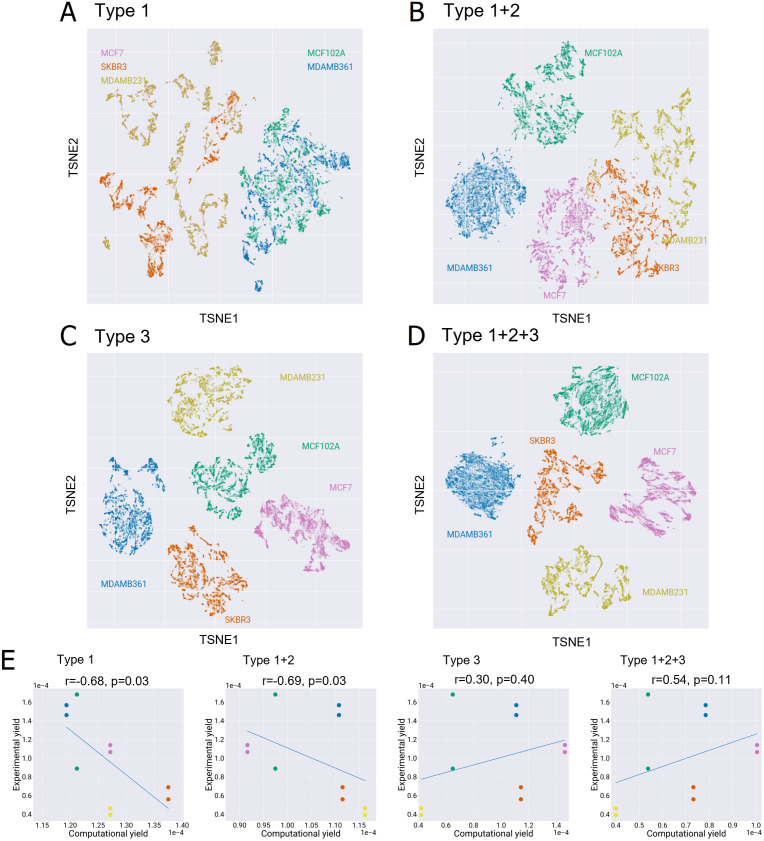
Fig 3. Evaluation of the effect of the different types of constraints on ENGRO2 feasible solutions.
Effect of constraints on A) nutrients availability (type 1), B) nutrients availability and extracellular fluxes (type 1+2), C) intracellular fluxes based on transcriptomics data (type 3) and all together (type 1+2+3) in segregating the five investigated cell lines. A two-dimensional map of the FFDs of the five cell lines in each setting is shown. For reversible reactions, that net flux is considered. For computational reasons, only 10000 steady-state solutions sampled within the feasible region of each model were plotted. E) Correlation between the experimental and in silico growth yield on glucose is reported for each of the four settings in panels A, B, C and D. The Spearman correlation coefficient and p-value are reported on top of each plot.

