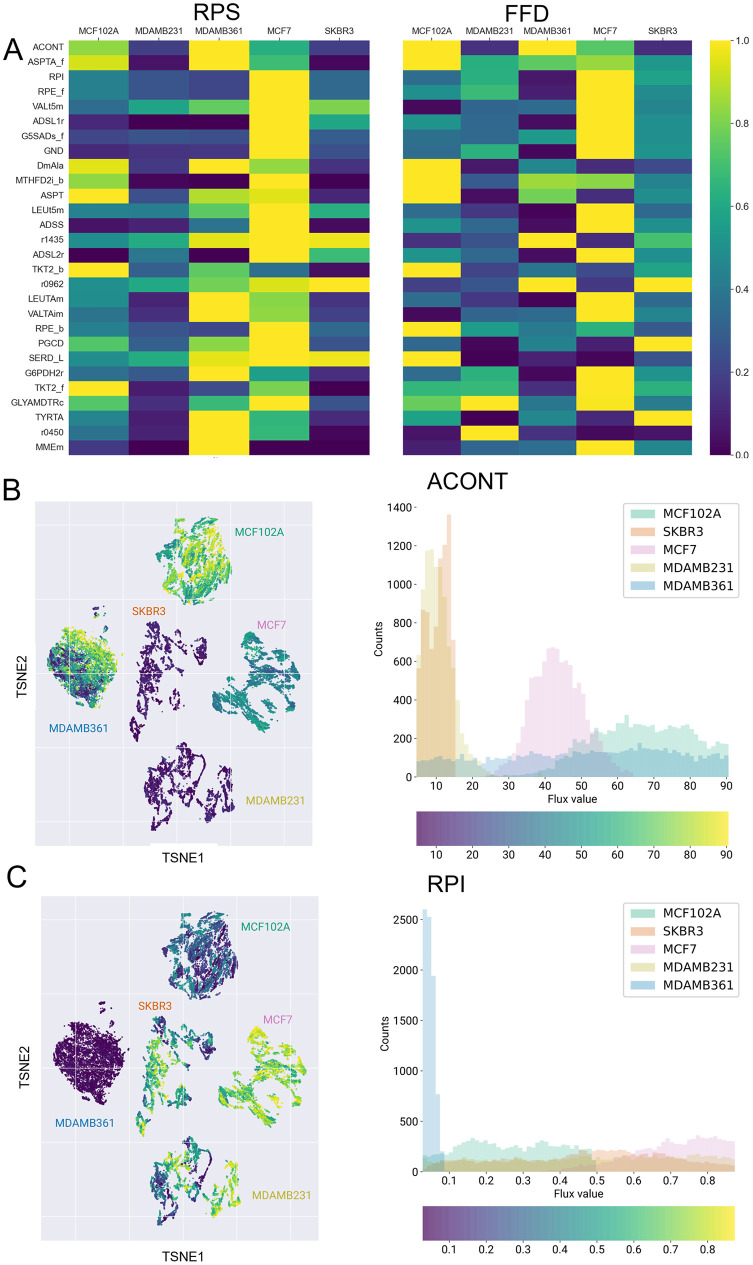
Fig 5.
A) Normalized average RPS and median FFD for reactions in Fig 4B. B) Left: same as Fig 3A (constraints 1+2+3) but with dots coloring representing the flux of cytosolic ACONT. Right: distribution of cytosolic ACONT flux values within the five cell lines. Histogram colors represent cell lines labels. C) Same as B for RPI reaction.

