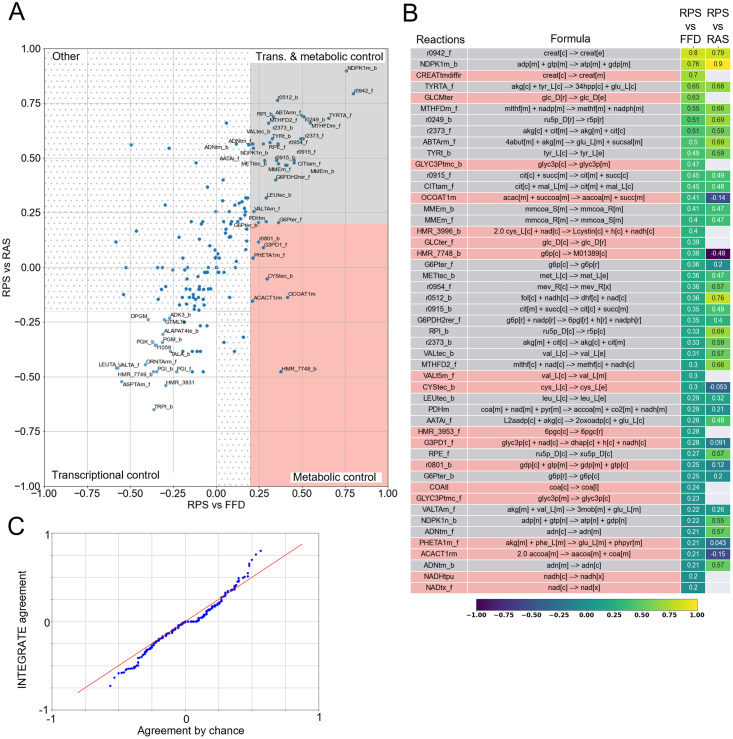
Fig 6. Variation concordance analysis for Recon3D.
A) RPSvsFFD (x-axis) and the RPSvsRAS (y-axis) scores of the metabolic reactions for which quantification of all substrate abundances was available. We reported the names of the reactions having at least one of the scores greater than 0.2 (i.e. fair concordance). B) Heatmap showing the RPSvsRAS and the RPSvsFFD concordance scores, for reactions having a level of concordance between RPS and FFD greater than 0.2. C) Q − Q plot between the empirical probability of agreement between two independent datasets and INTEGRATE Cohen’s kappa distribution related to the comparison between RPS and FFD.

