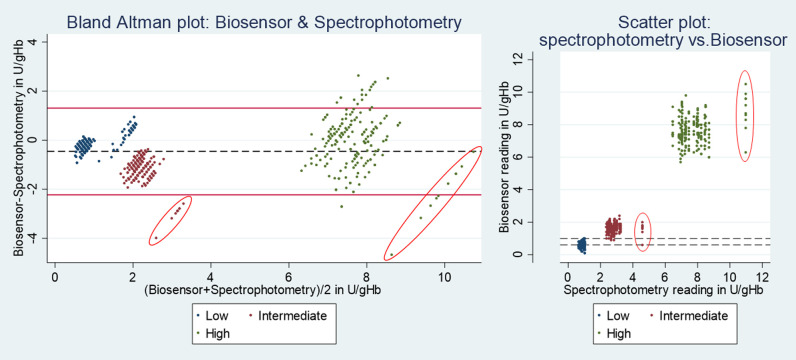
Fig 4.
Phase A: G6PD activity measured by Biosensor and spectrophotometry. Red circled results are influential points generated by spectrophotometry; Left: Red horizontal lines indicate upper and lower end of 95% limit of agreement, black dotted line indicates mean difference. Right: horizontal dotted lines indicate the overlap between Low and Intermediate readings by Biosensor.

