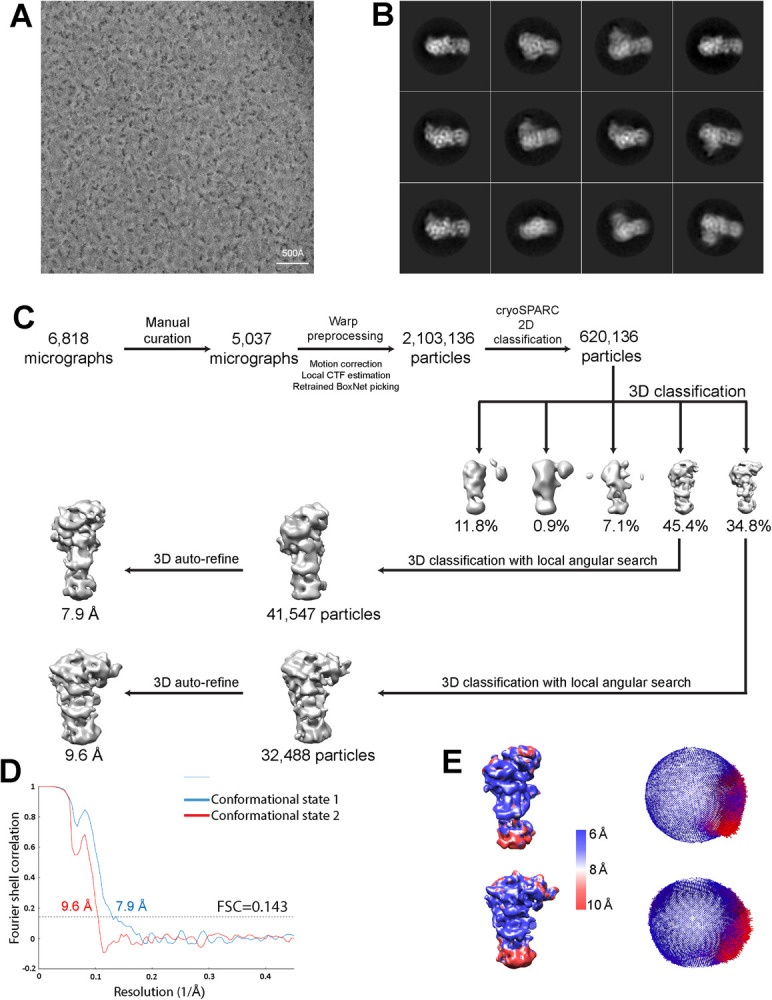
Fig 2. Image processing procedures.

(A) Representative micrograph. A total of 6,818 micrographs were collected and processed. (B) Representative 2D class averages from RELION reference-free 2D classifications. (C) Data processing workflow for cryo-EM map reconstruction. (D) FSC curves for the two conformations observed, resulting from gold standard 3D refinement. Resolution was determined with a 0.143 FSC threshold. (E) Local resolution estimated by Monores and angular distribution analyzed from RELION. Most parts of the two conformational EM structures are resolved in the resolution range of 6–10 Å.
