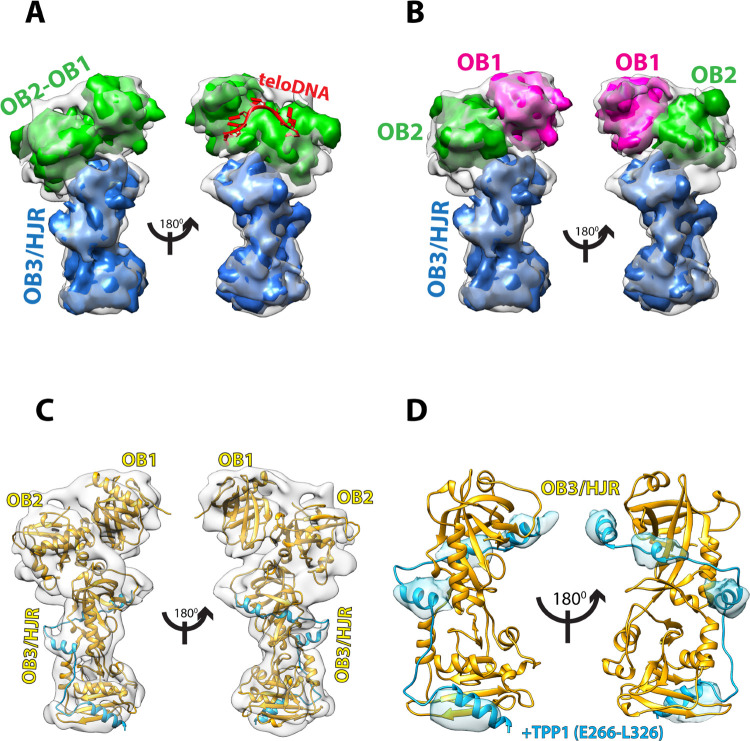
Fig 3. Cryo-EM map at 7.9 Å resolution of POT1 bound by TPP1 (E266-L326) with fitted crystal structures.
(A) Simulated 8 Å maps generated in Chimera for known crystal structures of POT1 domains were fitted into the 7.9 Å cryo-EM map to find structural complementarity. Simulated map for the crystal structure of POT1 (OB1-OB2) (PDB ID: 1XJV) (green) after removal of the ssDNA ligand fits the top half of the map, while simulated map for crystal structure of POT1 (OB3/HJR) complexed to the POT1-binding domain (PBD) of TPP1 (E266-L326) (PDB ID: 5UN7) (blue) fits the bottom half of the map. Placement of ssDNA ligand from PDB ID: 1XJV onto map depicts the location of the DNA-binding groove (red). (B) Simulated 8 Å maps for OB1 (magenta) and OB2 (green) demonstrate that improved complementarity of POT1 (OB1-OB2) can be achieved by fitting the OB1 and OB2 domains separately. (C) Cartoon representation of the structure of full-length POT1 (yellow) bound by the PBD of TPP1 (blue) which interacts with the OB3/HJR domain of POT1, fitted into the 7.9 Å cryo-EM map. (D) Fit of crystal structure of POT1 (OB3/HJR) complexed to the PBD of TPP1 shows that the α-helices of TPP1 (blue) overlap perfectly with four complimentary densities in the map (blue density).

