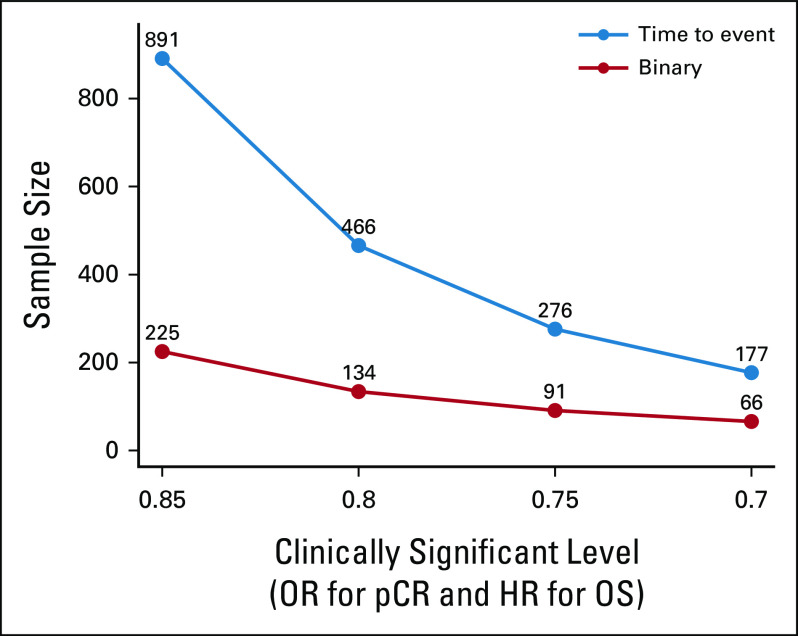
FIG 2.
Sample size differences between a traditional time-to-event end point (PFS or OS; in blue) and a binary surrogate end point (PCR; in red) in a phase III study design with power of 80% and two-sided type I error 5%. HR, hazard ratio; OR, odds ratio; OS, overall survival; pCR, pathologic complete response; PFS, progression-free survival.

