
Figure 3.
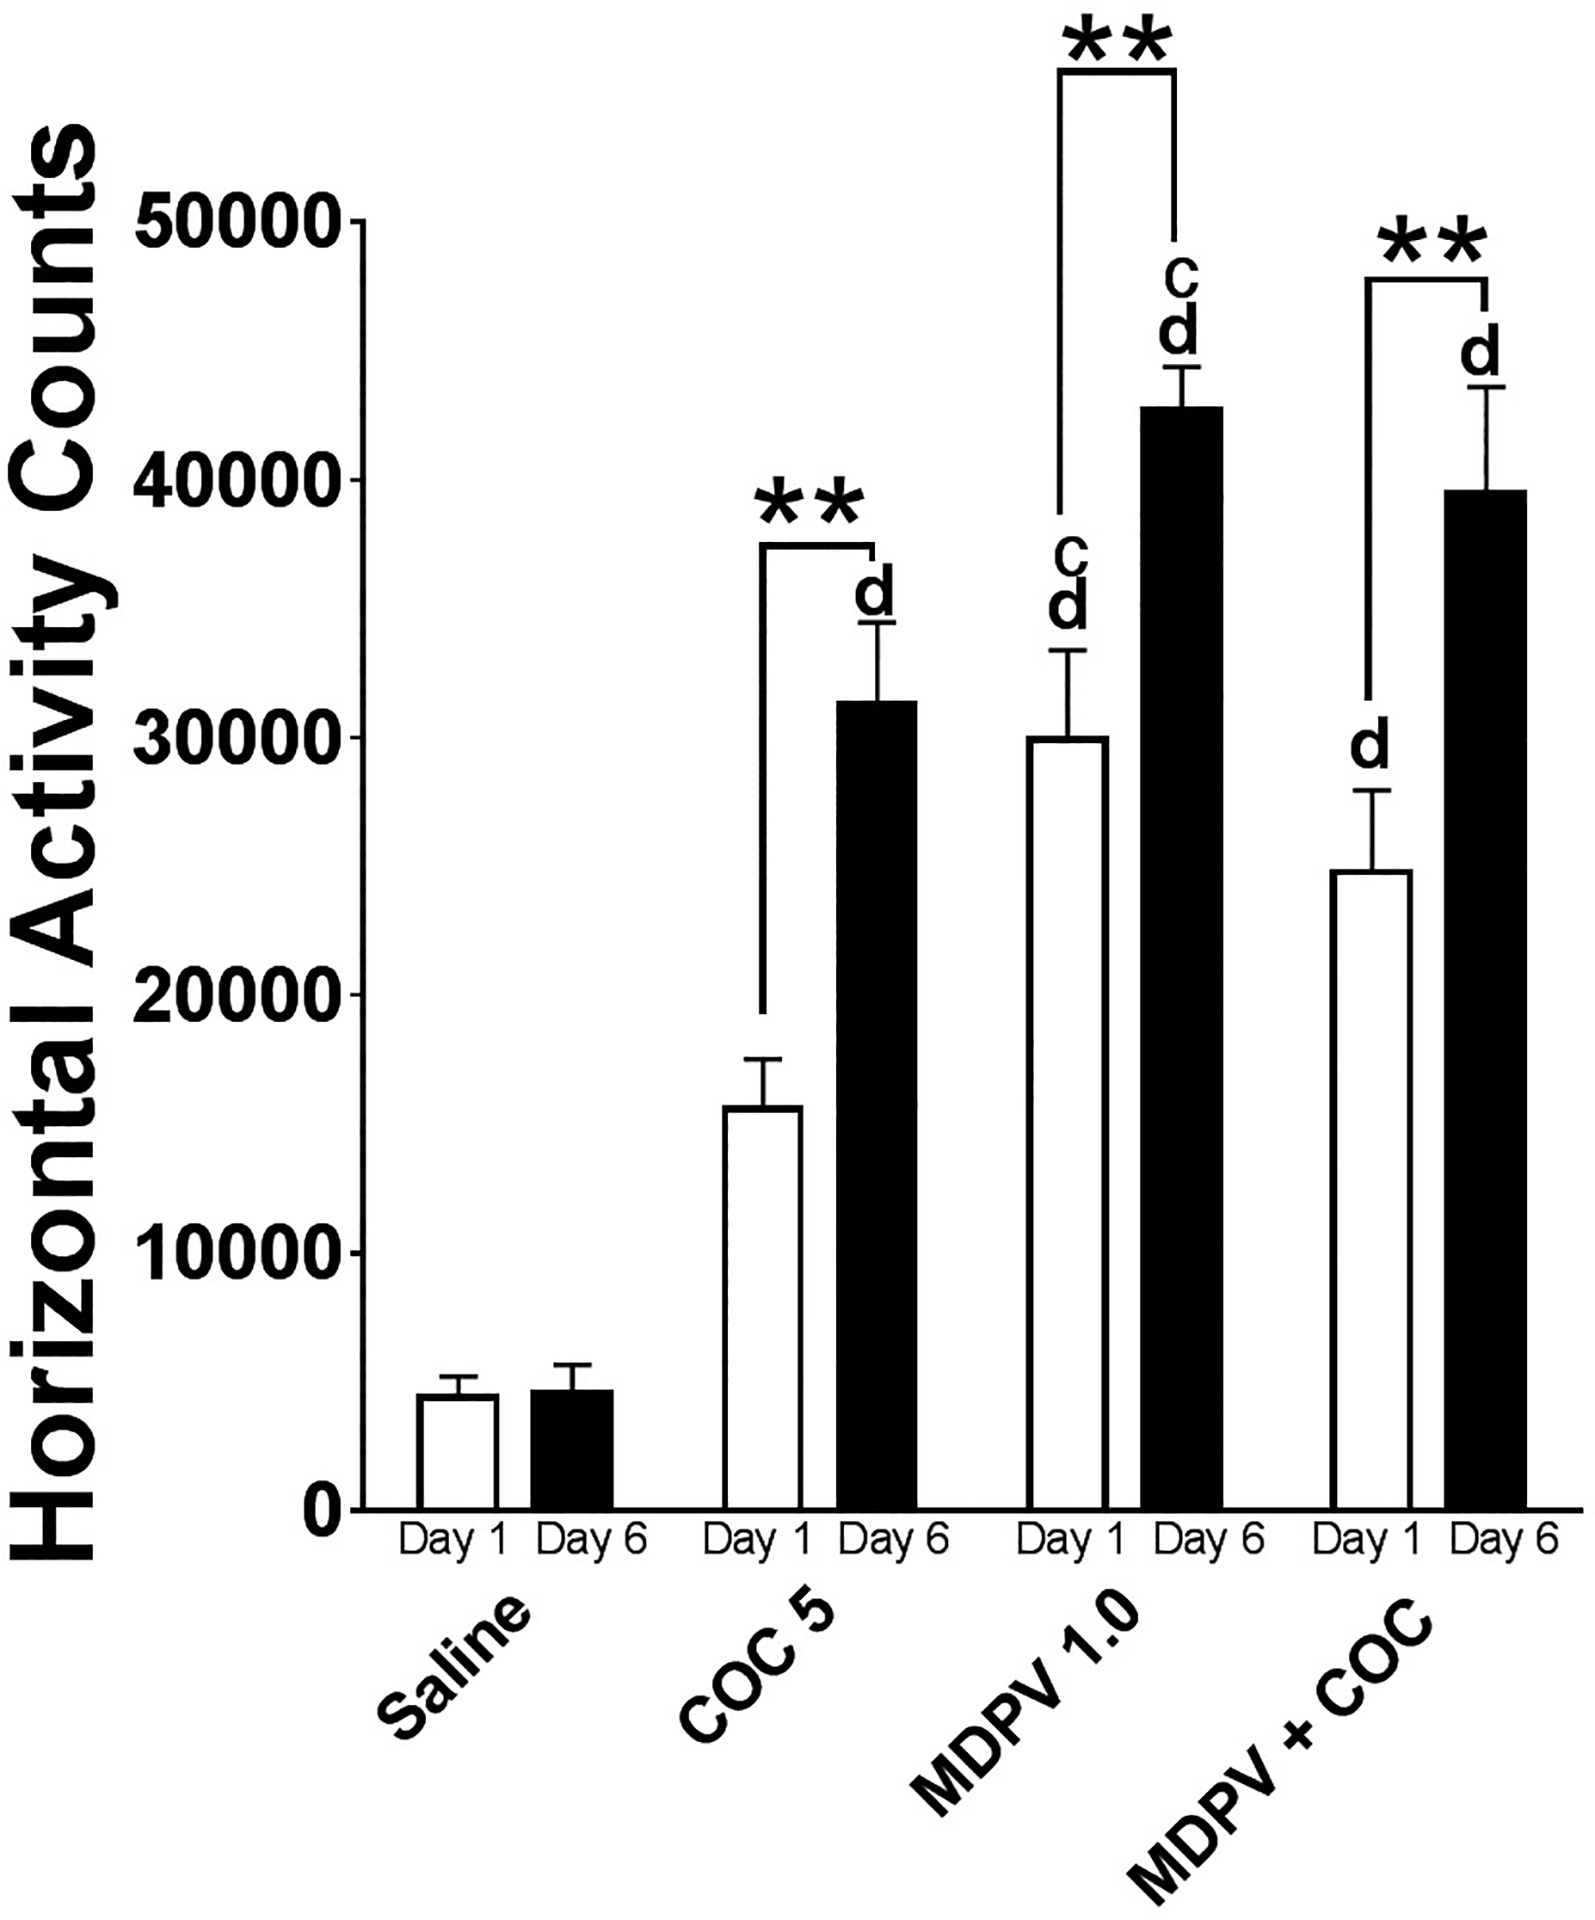
Total Locomotor Activity. Total horizontal activity counts for the one hour post-injection interval (61–120 min) for each treatment group on Day 1 and Day 6. Bars represent a treatment group means (± SEM). Asterisks (*) represent significant differences within groups (Day 1 vs. Day 6). Letters indicate statistically significant differences from COC 5 (c) or Saline (d).