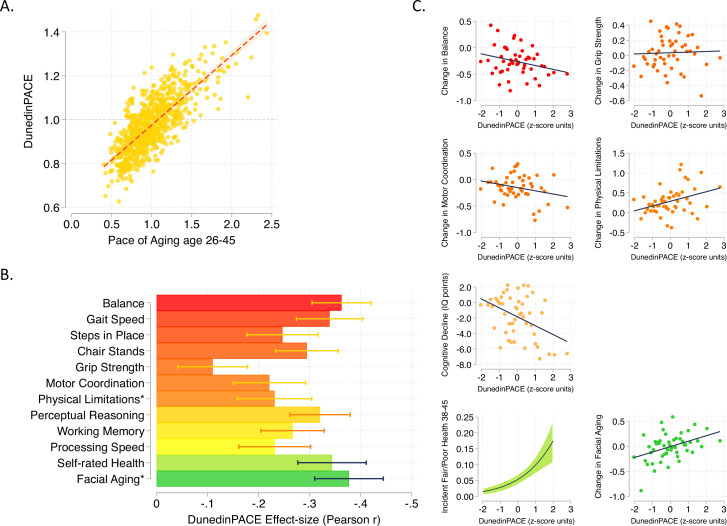
Figure 1. DunedinPACE correlation with 20-year Pace of Aging and association with decline in physical and cognitive functions and subjective signs of aging.
Panel A shows the association of DunedinPACE with the 20-year Pace of Aging in the Dunedin Study cohort (r = 0.78). Panel B shows effect-sizes for associations of DunedinPACE with measures of physical and cognitive functioning and subjective signs of aging in Dunedin Study members at age 45 years. Colors indicate groupings of measures (physical functions in shades of orange, cognitive functions in shades of yellow, subjective signs of aging in shades of green). Stars next to labels for Physical Limitations and Facial Aging indicate that these meaures were reverse-coded for this analysis. Panel C shows binned scatterplots of associations of DunedinPACE with declines in physical and cognitive function and subjective signs of aging. Plotted points show average values for ‘bins’ of approximately 20 Study members. Regression slopes are estimated from the raw, un-binned data. In Panel C, y-axis scales are denominated in units of standard deviations computed from the baseline measurement for all outcomes except self-rated health, for which the y-axis shows probability of incident fair/poor self-rated health. Changes were calculated over the interval between age-38 and age-45 assessments for all measures except cognition, for which change was calculated over the interval between the age-13 and age-45 assessments. DunedinPACE and DunedinPoAm were developed from analysis of Pace of Aging in the Dunedin cohort; effect-sizes for these measures may be over-estimated.
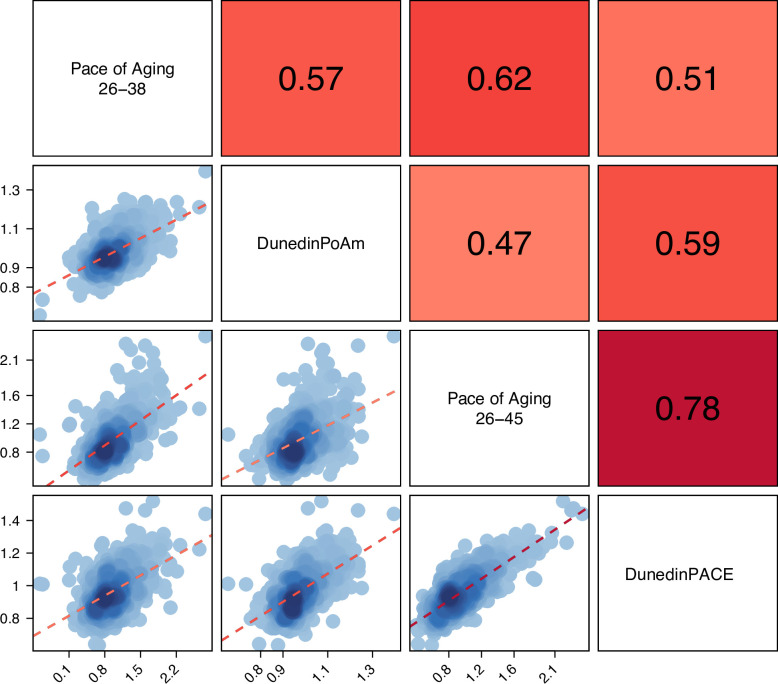
Figure 1—figure supplement 1. Correlations among the 12-year and 20-year Pace of Aging measures and the DunedinPoAm and DunedinPACE DNA methylation measures.
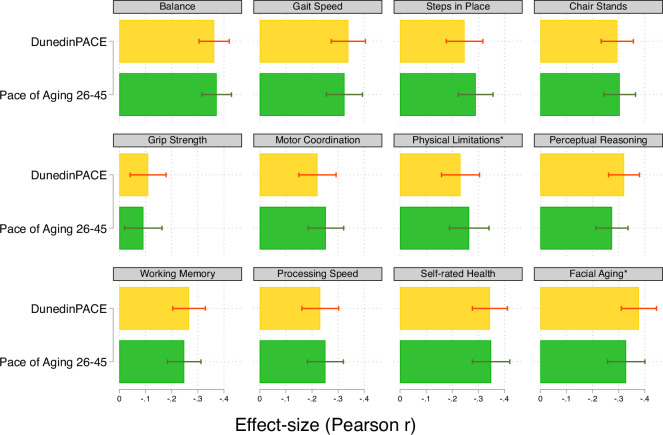
Figure 1—figure supplement 2. Effect-sizes for associations of DunedinPACE and the 20-year Pace of Aging with measures of physical and cognitive functioning and subjective signs of aging measured when Dunedin Study participants were aged 45 years.
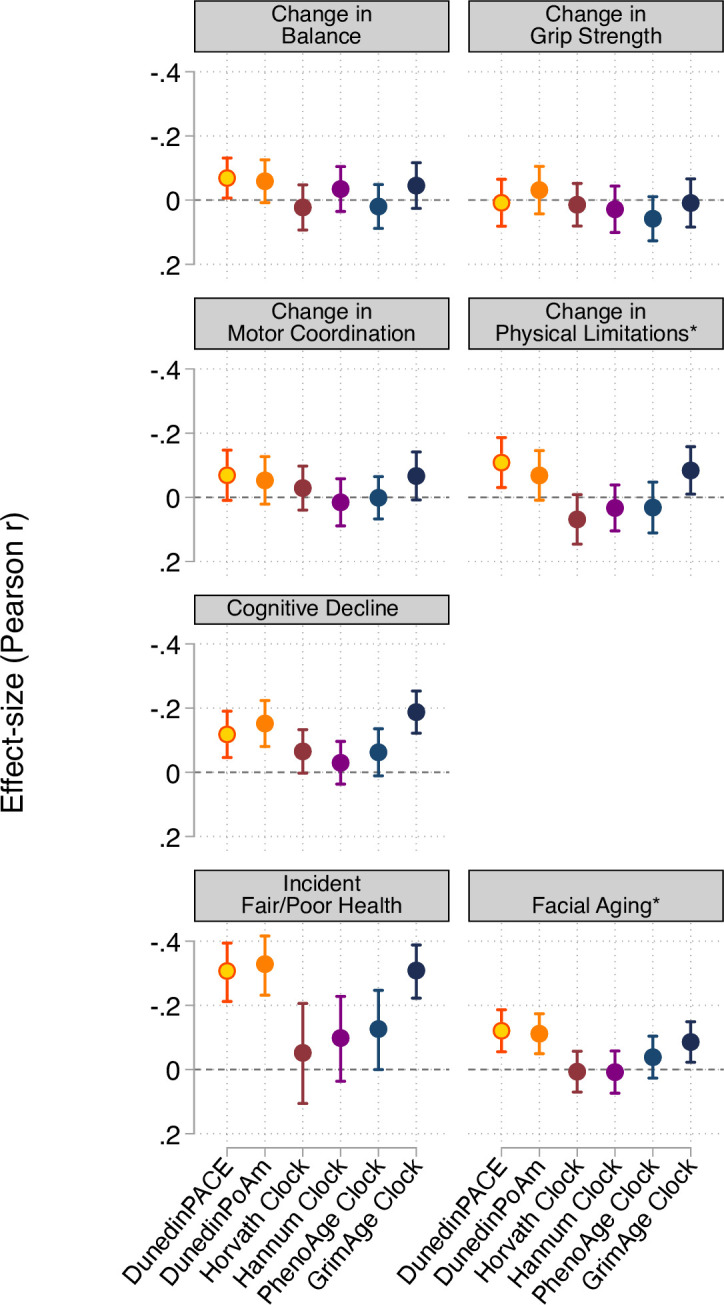
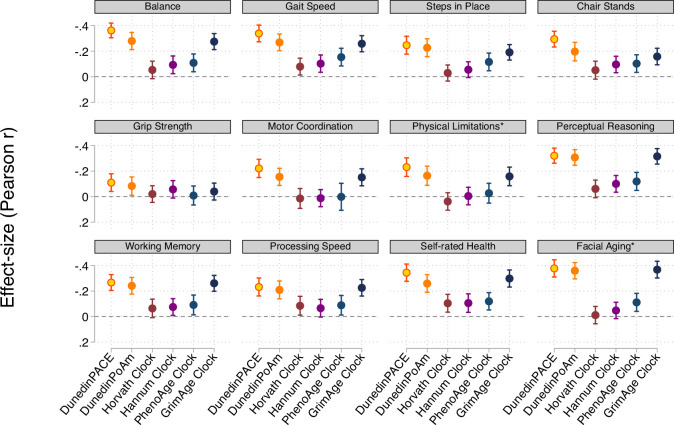
Figure 1—figure supplement 3. Effect-sizes for associations of DunedinPACE, DunedinPoAm, and the DNA methylation clocks proposed by Horvath, 2013, Hannum et al., 2013, Levine et al., 2018 (PhenoAge), and Lu et al., 2019 (GrimAge) with measures of physical and cognitive functioning and subjective signs of aging measured when Dunedin Study participants were aged 45 years.
Figure 1—figure supplement 4. Effect-sizes for associations of aging measures with measures of change in physical functioning and subjective signs of aging over ages 38–45 years and with cognitive functioning from adolescent baseline to age-45 follow-up.
