. 2022 Jan 14;11:e73420. doi: 10.7554/eLife.73420

Figure 4. Association of DunedinPACE with mortality.

Panel A shows mortality in the Normative Aging Study (NAS). Panel B shows mortality in the Framingham Heart Study Offspring Cohort. The figure plots Kaplan-Meier curves for three groups of participants in each of the two cohorts: those with DunedinPACE 1 SD or more below the mean (‘slow’ DunedinPACE, blue line); those with DunedinPACE within 1 SD of the mean (‘average’ DunedinPACE, purple line); and those with DunedinPACE 1 SD or more above the mean (‘fast’ DunedinPACE, red line). Censoring of participants prior to death is indicated with a gold hash marks. The table below the figure details the number of participants at risk per 3-year interval and, in parentheses, the number who died during the interval.

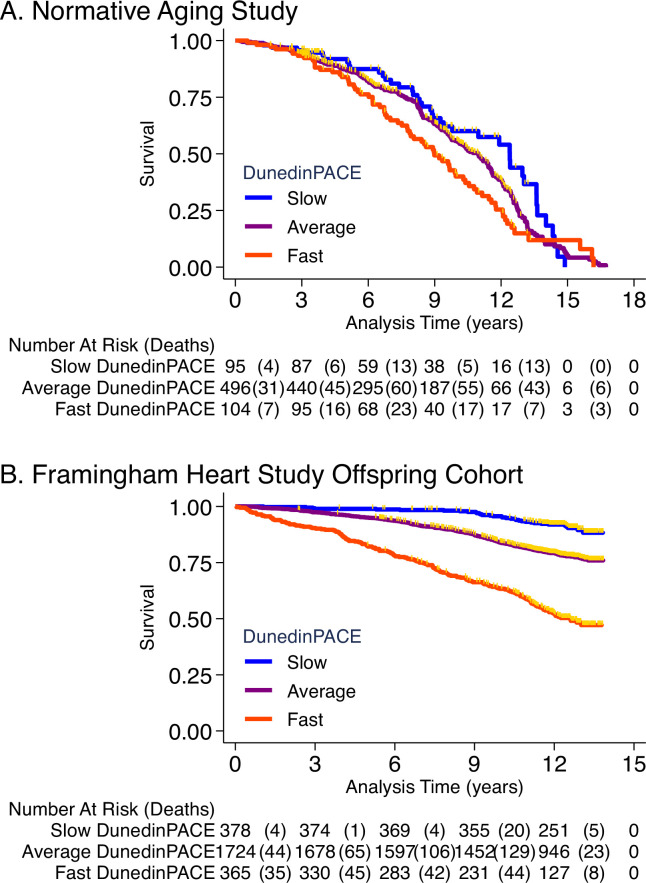
Figure 4.

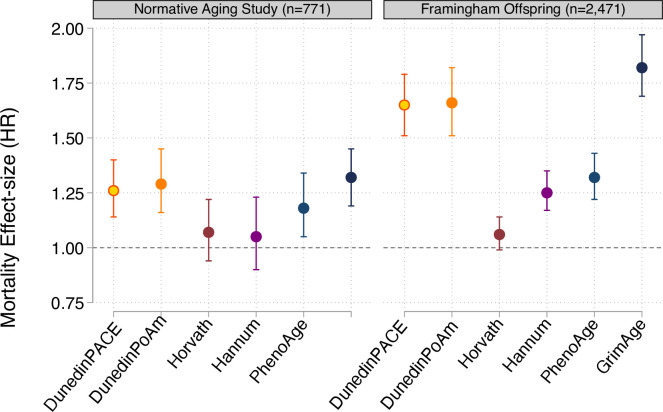
Figure 4—figure supplement 1. Effect-sizes for analysis of mortality in the Normative Aging Study and the Framingham Heart Study Offspring cohort.

Figure 4—figure supplement 1.

Effect-sizes are reported as hazard ratios (HR) per standard deviation increment of the aging measures estimated from Cox proportional hazard regression. All models included covariates for chronological age and sex.
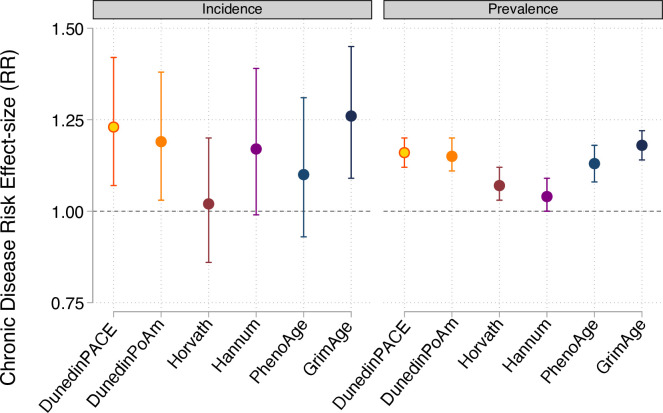
Figure 4—figure supplement 2. Effect-sizes for analysis of incident and prevalent chronic disease morbidity in the Normative Aging Study.

Figure 4—figure supplement 2.

Effect-sizes are reported as relative risks (RR) per standard deviation increment of the aging measures estimated from Poisson regression. All models included covariates for chronological age and sex.
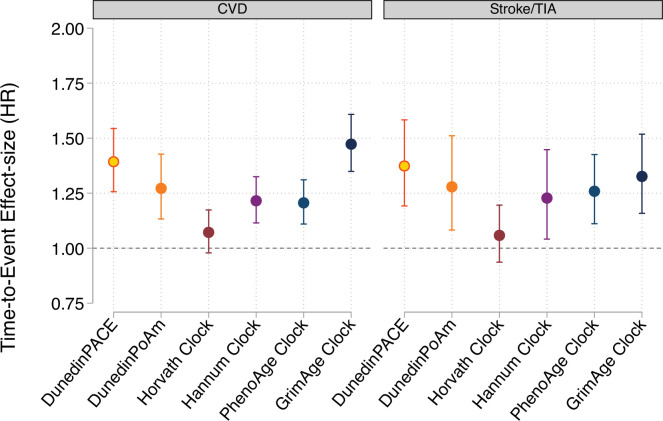
Figure 4—figure supplement 3. Effect-sizes for analysis of time-to-diagnosis with cardiovascular disease (CVD) and time to stroke or transient ischemic attack (TIA) in the Framingham Heart Study Offspring Cohort.

Figure 4—figure supplement 3.

Effect-sizes are reported as hazard ratios (HR) per standard deviation increment of the aging measures estimated from Cox proportional hazard regression. All models included covariates for chronological age and sex.
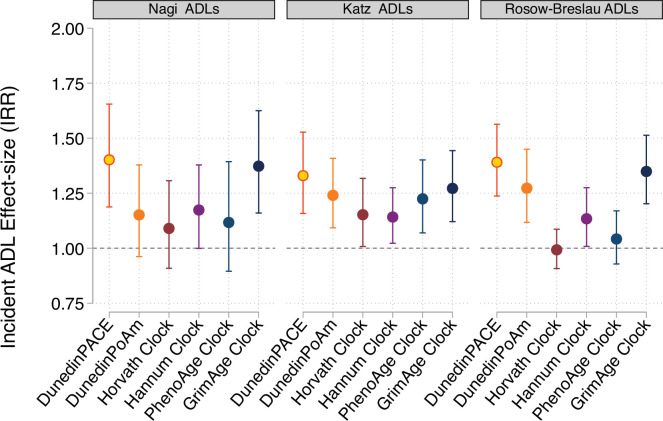
Figure 4—figure supplement 4. Effect-sizes for analysis of incident disability from repeated-measures of limitations to activities of daily living (ADLs).

Figure 4—figure supplement 4.

For all panels, error bars show 95% confidence intervals. DNA methylation clocks were residualized for chronological age prior to analysis. All models included covariates for chronological age and sex.