. 2022 Jan 14;11:e73420. doi: 10.7554/eLife.73420

Figure 5. DunedinPACE levels by strata of childhood socioeconomic status (SES) and victimization in the E-Risk Study.

Panel A (left side) plots means and 95% CIs for DunedinPACE measured at age 18 among E-Risk participants who grew up low, middle, and high socioeconomic status households. Panel B (right side) plots means and 95% CIs for DunedinPACE measured at age 18 among E-Risk participants who experienced 0, 1, 2, or 3 or more types of victimization through age 12 years.

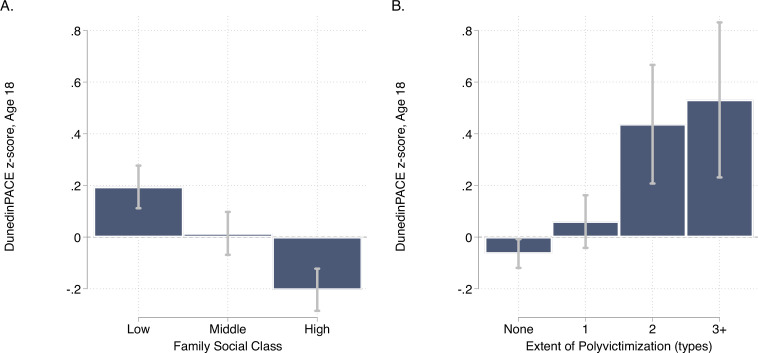
Figure 5.

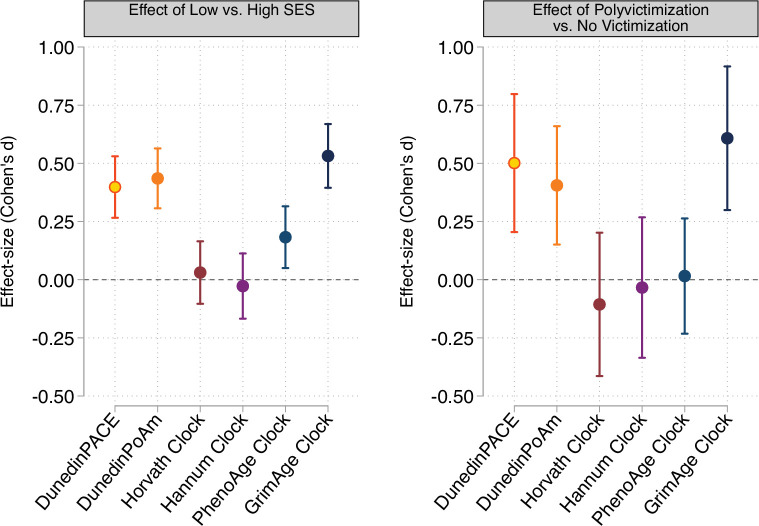
Figure 5—figure supplement 1. Effect-sizes for associations of childhood socioeconomic conditions and childhood victimization history with DunedinPACE, DunedinPoAm, and DNA methylation clocks at age 18.

Figure 5—figure supplement 1.

Panel A plots effect-sizes for low socioeconomic status (SES) in childhood (vs. high SES in childhood). Panel B plots effect-sizes for childhood polyvictimization (vs. no childhood victimization). Effect-sizes are reported as Cohen’s d. For both panels, error bars show 95% confidence intervals. DNA methylation clocks were residualized for chronological age prior to analysis. All models included sex as a covariate. (All E-Risk participants are the same chronological age; no age covariate is needed.).