. 2022 Jan 27;11:e76554. doi: 10.7554/eLife.76554

Figure 1. The gut microbial volatile metabolite trimethylamine (TMA) is elevated in alcohol-associated hepatitis (AH).

Plasma TMA (A) and trimethylamine N-oxide (TMAO) (B) levels in patients considered healthy (n = 13 for TMA and 20 for TMAO), or who have moderate (MELD < 20) (n = 52 for TMA and 111 for TMAO) or severe (MELD > 20) (n = 83 for TMA and 152 for TMAO) AH. (C) RNA sequencing results from liver tissues of patients with different pathologies, including: healthy controls (HC, n = 10), early AH (EAH, n = 12; MELD 7–8), AH with liver failure (AHL, n = 18; MELD 22–28), explant tissue from patients with severe AH with emergency liver transplants (ExAH, n = 10; MELD 18–21), non-alcohol-associated fatty liver disease (NAFLD; n = 8), hepatitis C virus (HCV; n = 9), and hepatitis C virus with cirrhosis (HCV_Cirr, n = 9). Gene expression was measured by transcripts per million (TPM). Boxplots of average expression for Fmo3 in different disease groups; error bars indicate SD (q < 0.05 in comparison to healthy controls). (D) Liver FMO3 protein expression measured by Western blot from healthy patients and patients with severe AH undergoing emergency liver transplant (Maddrey’s discriminant function 45–187). (E) Liver Tnfa, Il1b, Fmo3, and Taar5 transcript levels were measured by qPCR from female WT mice injected with either saline or lipopolysaccharide (LPS) for 6 hr. N = 6; unpaired Student’s t-test. *p ≤ 0.05; ***p ≤ 0.001.

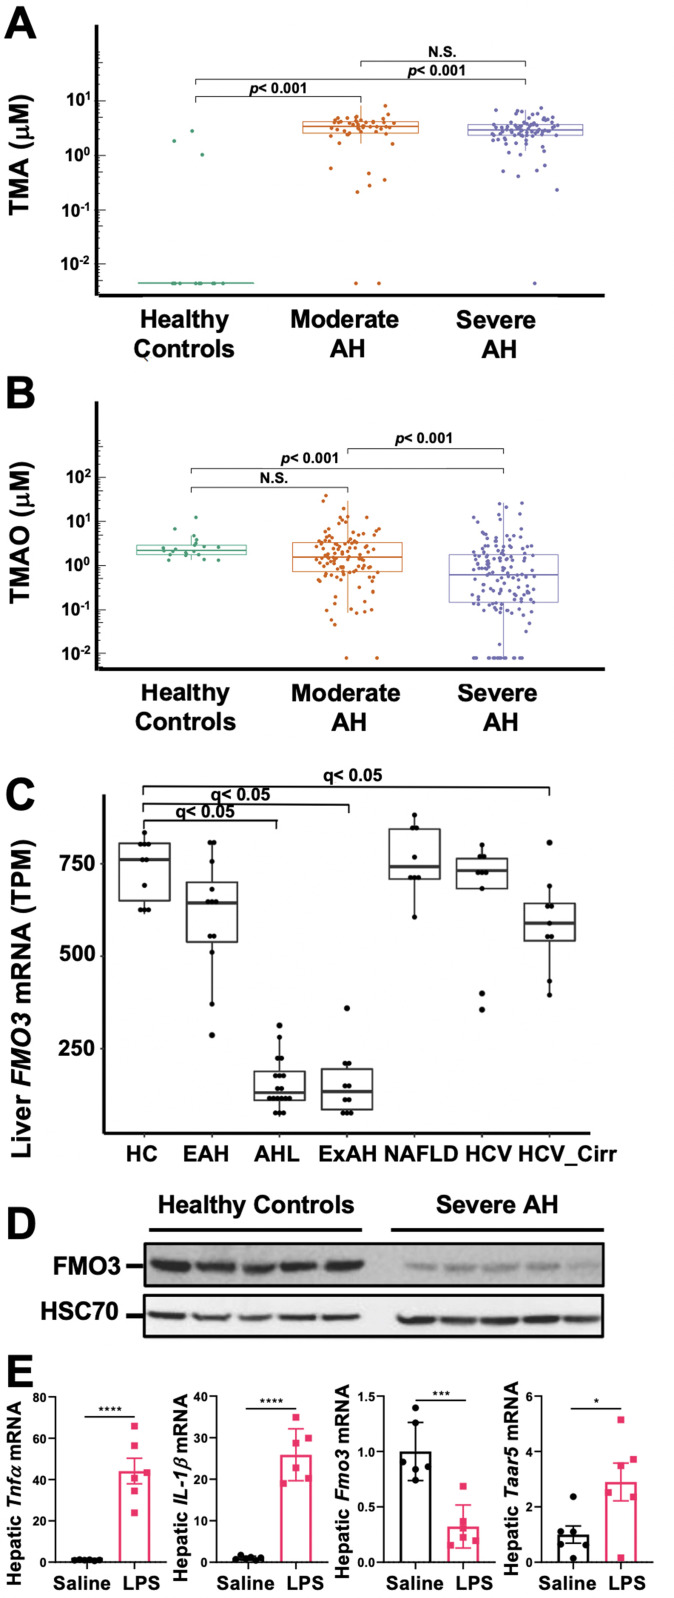
Figure 1—source data 1. Demographic and clinical parameters for entire cohort of healthy controls and patients with AH.
Figure 1—source data 2. Demographic and clinical parameters for subset of healthy controls and patients with AH included in TMA assay.
Figure 1—source data 3. Liver flavin-containing monooxygenase 3 (FMO3) protein expression measured by Western blot from healthy patients (HC) and patients with severe alcohol-associated hepatitis (AH) undergoing emergency liver transplant (Maddrey’s discriminant function 45–187).
These data are showing the entire blot.
Figure 1—source data 4. Liver flavin-containing monooxygenase 3 (FMO3) protein expression measured by Western blot from healthy patients (HC) and patients with severe alcohol-associated hepatitis (AH) undergoing emergency liver transplant (Maddrey’s discriminant function 45–187).
These data are showing the cropped version of the blot.
Figure 1—source data 5. Liver HSC70 protein expression measured by Western blot from healthy patients (HC) and patients with severe alcohol-associated hepatitis (AH) undergoing emergency liver transplant (Maddrey’s discriminant function 45–187).
These data are showing the entire blot.
Figure 1—source data 6. Liver HSC70 protein expression measured by Western Blot from healthy patients (HC) and patients with severe alcohol-associated hepatitis (AH) undergoing emergency liver transplant (Maddrey’s discriminant function 45–187).
These data are showing the cropped version of the blot.

Figure 1.

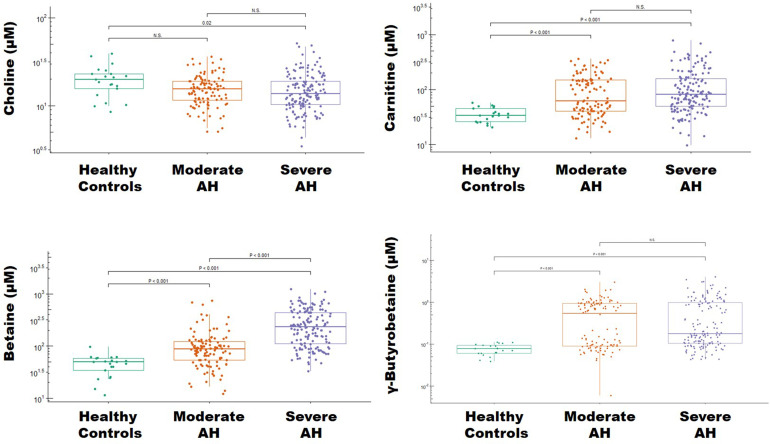
Figure 1—figure supplement 1. Levels of trimethylamine (TMA)-related metabolites in alcohol-associated hepatitis (AH).

Figure 1—figure supplement 1.

Boxplots depicting the plasma concentration of four TMA-related metabolites – choline, carnitine, betaine, and γ-butyrobetaine in healthy controls (n = 21) and patients with moderate (n = 112) and severe (n = 152) alcoholic hepatitis (AH). Statistical significance was determined by analysis of variance and a Tukey’s honest significant difference post hoc test (p < .05).