. 2022 Jan 25;11:e72917. doi: 10.7554/eLife.72917

Figure 4. Remyelination is delayed in the nerves of the dKO mice.

(A) Representative transmission TEM images of P60 sciatic nerves uninjured (UI) and 10, 20, and 30 days post crush (dpi) of dKO (Mpz-Cre+/−; Hdac4flx/flx; Hdac5−/−) and the control (Mpz-Cre−/−; Hdac4flx/flx; Hdac5−/−) littermates are shown. Scale bar: 5 μm. (B) No statistically significant differences were observed in the area of the dKO nerves and control littermates (UI: p = 0.804; 10 dpi: p = 0.195; 20 dpi: p = 0.559; 30 dpi: p = 0.0594). (C) The number of myelinated axons is notably decreased at 10 dpi (388 ± 55 in the dKO versus 1.889 ± 330 in the control; p = 0.0005). (D) g ratio was increased at 10 dpi (0.989 ± 0.003 in the dKO versus 0.934 ± 0.015 in control [p = 0.002]) and at P21 (0.776 ± 0.003 in the dKO versus 0.767 ± 0.003 in control [p = 0.043]). (E) The number of unmyelinated axons in a 1:1 relationship with Schwann cells was notably increased at 10 dpi (2.969 ± 203 in the dKO versus 1.512 ± 119 in controls; p = 0.0007) and at 20 dpi (224 ± 25 in the dKO versus 88 ± 14 in controls; p = 0.0016). (F) The total number of unmyelinated axons in a 1:1 relationship with Schwann cells is increased at 10 dpi (2.148 ± 155 in the dKO versus 1.158 ± 56 in the control; p = 0.0011) at 20 dpi (175 ± 20 in the dKO versus 68 ± 12 in the control; p = 0.002) and at 30 dpi (63 ± 17 in the dKO versus 22 ± 5 in the control; p = 0.043). (G) No changes in the total axon number was found (UI: p = 0.157; 10 dpi: p = 0.910; 20 dpi: p = 0.349; 30 dpi: p = 0.666). (H) Neither in the total sorted axon number (UI: p = 0.193; 10 dpi: p = 0.169; 20 dpi: p = 0.294; 30 dpi: p = 0.682). (I) The total number of Schwann cells (counted as nuclei) was increased at 20 dpi (861 ± 34 in the dKO versus 630 ± 53 in controls; p = 0.0041). (J) In contrast, the number of myelinating Schwann cells was found decreased at 10 dpi (35 ± 8 in the dKO versus 164 ± 37 in controls; p = 0.0032). (K) The percentage of myelinated axons is decreased at 10 dpi (15.5 ± 2.3% in the dKO versus 60.4 ± 4.8% in controlps; p < 0.0001), 20 dpi (96.6 ± 0.4% in the dKO versus 98.8 ± 0.2% in controls; p = 0.0016) and, although much less, at P21 (98.9 ± 0.3% in the dKO versus 99.6 ± 0.1% in controls; p = 0.0482). For these experiment, three to six animals per genotype were used; unpaired t-test was applied for statistical analysis. (L) Expression of several negative regulators of myelination and repair Schwann cell markers is enhanced at 10 dpi in the sciatic nerves of the dKO: Jun (1.51-fold; p = 0.0056), Gdnf (1.85-fold; p = 0.0025), Bdnf (2.60-fold; p = 0.001), and Olig1 (1.60-fold; p = 0.008). (M) Expression of positive regulators and myelin genes is decreased at 10 dpi in the sciatic nerves of the dKO: Krox-20 (0.47-fold; p = 0.0068), Prx (0.45-fold; p = 0.001), Mpz (0.33-fold; p = 0.005), and Mbp (0.33-fold; p = 0.012). RT-qPCR with mouse-specific primers for the indicated genes was performed and normalized to 18S rRNA. The scatter plot, which include also the mean ± SE, shows the fold change of mRNA for each gene at 10 dpi normalized to the uninjured nerve. Five to eight mice per genotype were used. Data were analyzed with the unpaired t-test with Welch’s correlation. (N) A representative WB of protein extracts from dKO, control, KO5−/− and wild-type nerves is shown. In the quantification, JUN protein remains higher in the dKO at 10 dpi (1.72 ± 0.17-fold; p = 0.012) and tend to equalize at 21 dpi. MPZ protein was found decreased by 0.32 ± 0.02-fold at 21 dpi (p = 0.02), however we could not find changes in KROX-20 (KO5−/− mice were used to compare with the wild-type littermates). Densitometric analysis was done on seven to nine WB from the same number of mice and normalized to 10 dpi WT. Data were analyzed with the unpaired t-test (*p < 0.05; **p < 0.01; ***p < 0.001; ns: no significant). See source data file one online (graphs source data) for more details.

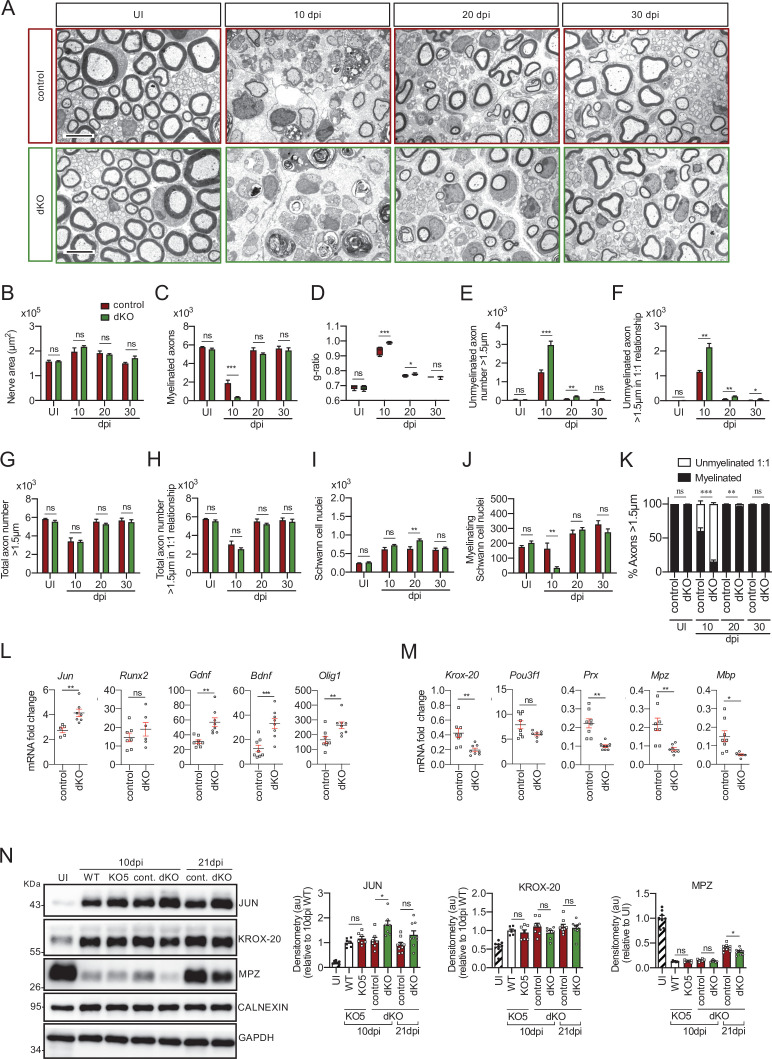
Figure 4.

Figure 4—figure supplement 1. Remyelination in the cKO4 mice.

Figure 4—figure supplement 1.

(A) Representative transmission TEM images of P60 sciatic nerves uninjured (UI) and 10, 20, and 30 days post crush (dpi) of dKO (Mpz-Cre+/−; Hdac4flx/flx) and the control (Mpz-Cre−/−;Hdac4flx/flx) littermates are shown. Scale bar: 5 μm. (B) Only slight significant statistically differences were observed in the area of the cKO4 at 10 dpi (p = 0.0372). (C) The number of myelinated axons was not changed at any point. (D) The same for g ratio. (E) The number of unmyelinated axons >1.5 μm was increased at 10 dpi in the cKO4 (1.730 ± 175 in the control versus 2.266 ± 116 in the cKO4; p = 0.024). (F) The total number of unmyelinated axons in a 1:1 relationship with Schwann cells is increased at 10 dpi (1.869 ± 115 in the cKO4 versus 1.472 ± 130 in the control; p = 0.0047). No changes in the total axon number were found (G) neither in the sorted total axon number (H). (I) The total number of Schwann cells (counted as nuclei) was increased at 20 dpi (765 ± 29 in the cKO4 versus 643 ± 41 in controls; p = 0.0041) and at 30 dpi (752 ± 34 in the cKO4 versus 575 ± 32 in controls; p = 0.0066). (J) The number of myelinating Schwann cells was slightly increased at 20 dpi (368 ± 15 in the cKO4 versus 319 ± 14 in controls; p = 0.0045). (K) The percentage of myelinated axons was decreased at 10 dpi (29.0 ± 3.2% in the cKO4 versus 42.8 ± 5.4% in controls; p = 0.0474). For these experiments, four to seven animals per genotype were used; unpaired t-test was applied for statistical analysis. (L) A representative WB of protein extracts from cKO4 and control nerves is shown. In the quantification, JUN protein was higher in the cKO4 at 10 dpi and tended to equalize at 21 dpi. No changes were found in KROX-20 or MPZ. Densitometric analysis was done on foue to six WB from the same number of mice. Data were analyzed with the unpaired t-test. To decrease the variability of standardizing for a condition with low expression, normalization was done for conditions with higher protein expression. (M) Expression of Jun, Runx2, and Gdnf at 10 dpi was not changed in the sciatic nerves of the cKO4. (N) Expression of Krox-20 and Pou3f1 was not changed, whereas Prx, Mpz, and Mbp expression was decreased in the cKO4 sciatic nerve at 10 dpi. RT-qPCR with mouse-specific primers for the indicated genes was performed and normalized to 18S rRNA. The scatter plot, which include also the mean ± standard error (SE), shows the fold change of mRNA for each gene at 10 dpi normalized to the uninjured nerve. Four to six mice per genotype were used. Data were analyzed with the unpaired t-test. (O) A representative toluidine blue staining image of 4 days cut sciatic nerve of cKO4 and control mice is shown. The quantification of intact myelin sheaths showed no changes in the cKO4. Six animals were used for the experiment. Scale bar: 10 μm. Data were analyzed with the unpaired t-test. Primer sequences and antibodies are listed online (Key Resources Table) (*p < 0.05; **p < 0.01; ***p < 0.001; ns: no significant). See source data file one online (graphs source data) for more details.
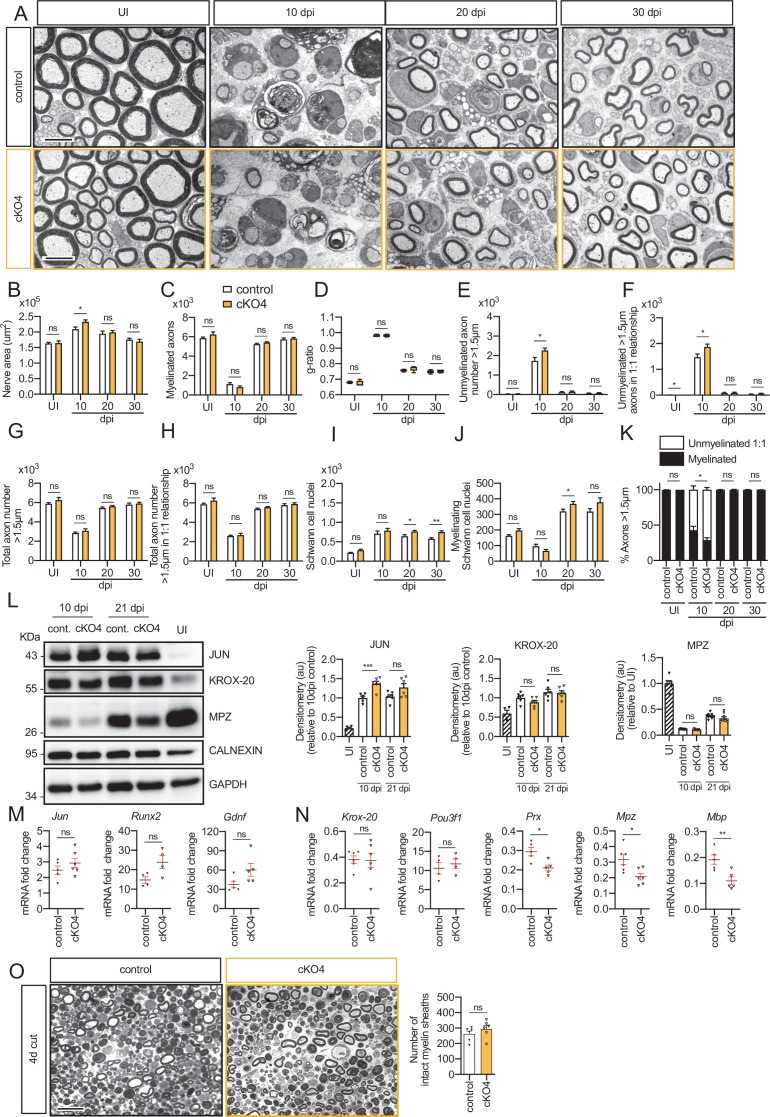
Figure 4—figure supplement 2. Remyelination in the KO5 mice.

Figure 4—figure supplement 2.

(A) Representative transmission TEM images of P60 sciatic nerves uninjured (UI) and 10, 20, 30, and 60 days post crush (dpi) of KO5 (HDAC5−/−) and the WT control littermates are shown. Scale bar: 5 μm. (B) A slight increase in the area of the KO5 at 60 dpi (p = 0.0419) was found. (C) The number of myelinated axons was not changed at any point. (D) The g ratio was found slightly decreased in at 20 dpi in the KO5 (0.75 ± 0.004 in the KO5 versus 0.78 ± 0.007 in the control; p = 0.0154). (E) The number of unmyelinated axons >1.5 μm was slightly increased at 60 dpi in the KO5 (52 ± 10 in the control versus 22 ± 6 in the KO5; p = 0.0352). The total number of unmyelinated axons in a 1:1 relationship with Schwann cells (F), the total axon number (G), the total number of sorted axons (H), the total number of Schwann cells (counted as nuclei) (I), the number of myelinating Schwann cells (J) neither the percentage of myelinated axons (K) were found changed at any point. For these experiments, three to five animals per genotype were used. Unpaired t-test was applied for statistical analysis. (L) Expression of Jun, Runx2, and Gdnf at 10 dpi was not changed in the sciatic nerves of the KO5. (M) Expression of Krox-20, Pou3f1, Prx, and Mpz was not changed, whereas Mbp expression was slightly decreased in the KO5 sciatic nerve at 10 dpi. RT-qPCR with mouse-specific primers for the indicated genes was performed and normalized to 18S rRNA. The scatter plot, which include also the mean ± SE, shows the fold change of mRNA for each gene at 10 dpi normalized to the uninjured nerve. Four to six mice per genotype were used. Data were analyzed with the unpaired t-test. (N) A representative toluidine blue staining image of 4 days cut sciatic nerve of KO5 and control mice is shown. The quantification of intact myelin sheaths showed no changes in the KO5. Scale bar: 10 μm. Six animals were used for the experiment. Data were analyzed with the unpaired t-test. Primer sequences are listed in source data section online (Key Resources Table) (*p < 0.05; **p < 0.01; ***p < 0.001; ns: no significant). See source data file one online (graphs source data) for more details.
Figure 4—figure supplement 3. Myelin clearance and repair phenotype activation in the dKO mice.

Figure 4—figure supplement 3.

(A) A representative toluidine blue staining image of 4 days cut sciatic nerve of dKO and control mice is shown. The quantification of intact myelin sheaths showed no changes. Scale bar: 10 μm. Four to five animals were used for the experiment. Data were analyzed with the unpaired t-test. (B) WB against JUN and MPZ supports that myelin clearance is normal in the dKO nerves. CALNEXIN and GAPDH were used as housekeeping. Three mice per genotype were analyzed independently by densitometry. To decrease the variability of standardizing for a condition with low expression, normalization was done for conditions with higher protein expression. Data were analyzed with the one-way analysis of variance (ANOVA) Tukey’s test. (C) Repair phenotype activation was determined by measuring the expression of marker genes and comparing with the uninjured control nerve. As is shown only a slight increase in the expression of Jun at 1 day after cut in the dKO was found (3.71 ± 0.24 in the dKO versus 2.35 ± 0.22 in the control; p = 0.0102). RT-qPCR with mouse-specific primers for the indicated genes was performed and normalized to 18S rRNA. Graph shows the percentage of mRNA for each gene in the injured nerve normalized to the uninjured controls. A scatter plot is shown with the results obtained, which include also the mean ± standard error (SE). Three to four mice per genotype were used. Data were analyzed with the unpaired t-test. Primer sequences and antibodies are listed online (Key Resources Table) (*p < 0.05; **p < 0.01; ***p < 0.001; ns: not significant). See source data file one online (graphs source data) for more details.