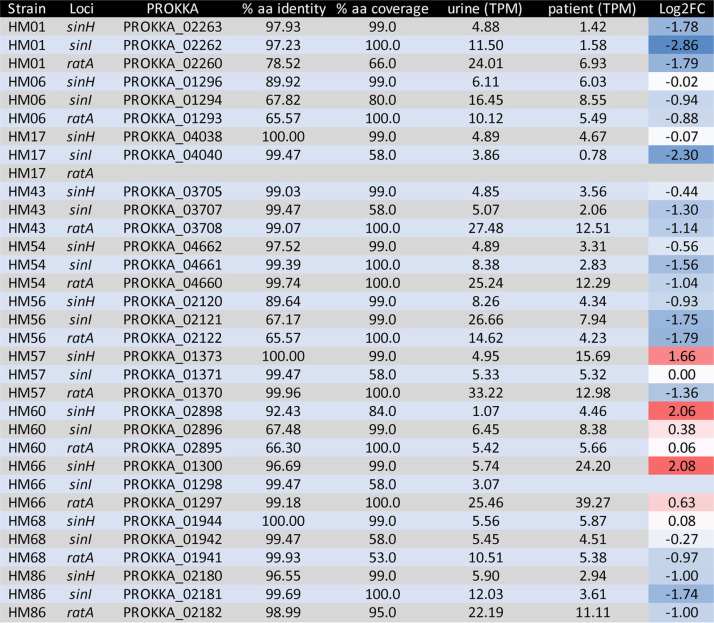
TABLE 2.
In vitro and in vivo expression of sinH, sinI, and ratA in strains isolated from human UTIa
Expression of sinH, sinI, and ratA in 11 UPEC clinical isolates was measured in transcripts per million (TPM), with a higher value indicating greater expression. The table is sorted by genome and then gene locus, given in columns 1 and 2, respectively. Columns 4 and 5 show the percent amino acid similarity of the clinical strain compared to the CFT073 sequence, while columns 6 and 7 indicate the gene expression in vitro (6) and in vivo (7). Column 8 provides the log2 fold change (FC) of expression between in vivo and in vitro (patient/urine), with positive values indicating greater expression in human patients (red) and negative values indicating greater expression in human urine ex vivo (blue). The values are color coded via gradient scale; thus, the darker the red, the more intense the upregulation in patient samples, and the red transitions toward white as the values approach zero, indicative of equal expression in vivo and in vitro.

