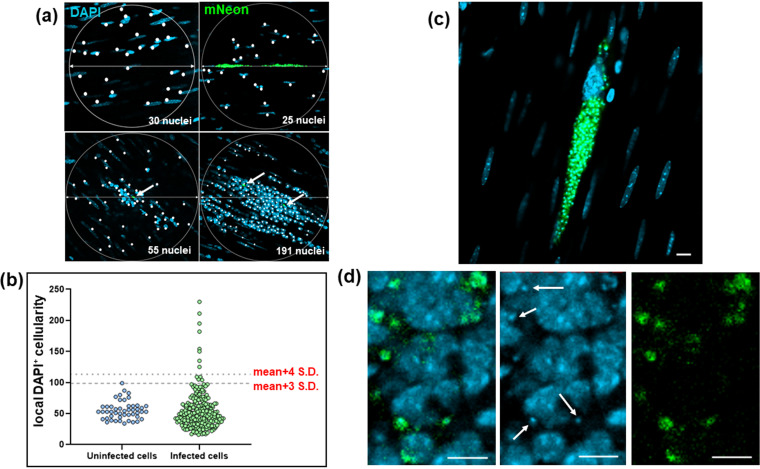
FIG 5.
Defining the localized cellularity of T. cruzi-infected host cells in the colonic gut wall. (a) Images of whole mounted colonic gut wall from C3H/HeN mice chronically infected with T. cruzi CL-Luc::mNeon (Materials and Methods). When infection foci were identified, 200-μm-diameter circles were drawn centered on each parasite cluster, or nest. Circles were placed by centering on randomly selected cells in the case of noninfected age-matched controls (top left). DAPI-stained nuclei (blue) that fell within this disc (highlighted by white dots) were counted as a measure of cellularity. Intracellular parasites can be identified by green fluorescence. These are indicated by white arrows in the lower images. (b) Background cellularity around randomly selected cells (n = 48) on whole mounted colonic gut walls from naive age-matched C3H/HeN mice was established as described above. With tissue from chronically infected mice, localized cellularity was calculated using circles centered on parasite foci (green) (n = 247). Individual values are indicated by blue (noninfected) and green (infected) dots. The dashed lines indicate 3 SD and 4 SD above the background mean. (c) An infected myocyte where the local cellularity is equivalent to the background level and the intracellular amastigotes (green) are structurally intact. (d) Zoomed-in image of an intense cellular infiltrate (nuclei; blue) in which the T. cruzi parasites (green) display an irregular and diffuse morphology. Parasite DNA is identifiable as small discrete DAPI-stained spheres throughout this inflammatory focus (examples indicated by white arrows). Bars = 20 μm.

