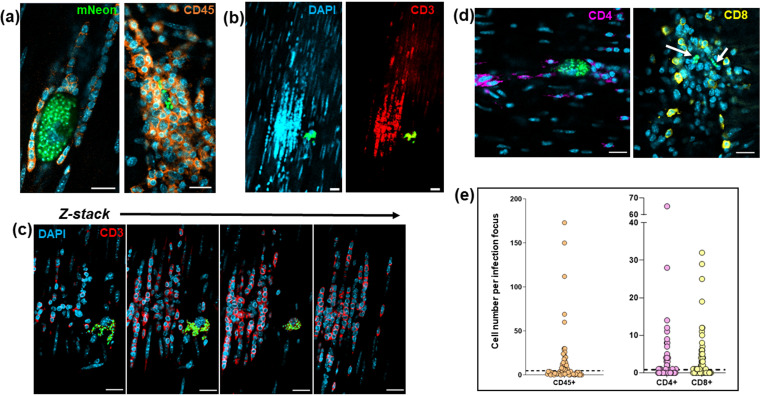
FIG 6.
T cells are major constituents of the leukocyte population recruited to chronic-stage infection foci. (a) Confocal images of colonic gut wall sections from chronically infected mice (Materials and Methods). Rare infection foci were identified by mNeonGreen fluorescence (parasites) after exhaustive searching of whole mounted gut walls. Staining with anti-CD45 (orange) reveals that hematopoietic cells constitute the vast majority of the infiltrate population. Host cell nuclei were identified by DAPI staining (blue). (b) Anti-CD3 staining of cellular infiltrates shows that T cells constitute a majority of the population. Blue, host cell nuclei; red, CD3 staining; green, parasite fluorescence. (c) Serial Z-stack imaging (Materials and Methods) through the same cellular infiltrate as in panel b, showing selected sections through the infiltrate. (d) Histological sections containing cellular infiltrates and associated infection foci (parasites, green; indicated by white arrows in right-hand image) stained with either anti-CD4 (purple) or anti-CD8 (yellow) antibodies. Bars = 20 μm. (e) Whole mounts containing infection foci were stained with anti-CD45, anti-CD4, or anti-CD8 antibodies and the number of positive host cells in the immediate vicinity (314-μm3 volume) was determined by serial Z-stack confocal imaging. Each dot corresponds to a single infection focus. The horizontal dashed line is 3× above the SD of the mean background level in noninfected tissue. In the case of anti-CD45 staining, none of the 50 tissue regions examined from noninfected mice contained numbers of CD45+ cells above this value. Of infection foci identified by CD45, CD4, and CD8 staining, 41%, 45%, and 42%, respectively, were above this cutoff.

