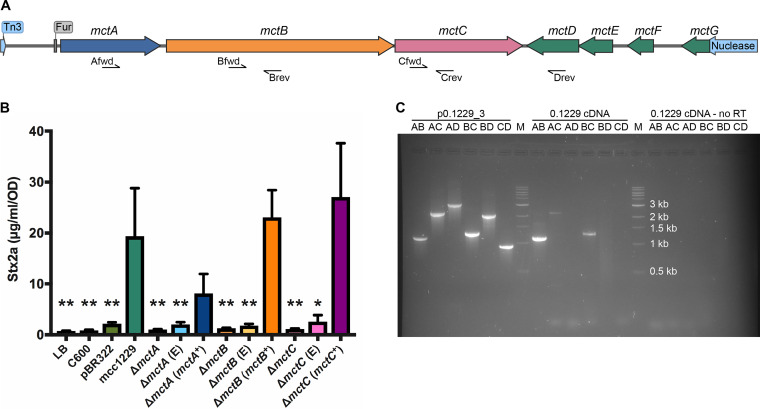
FIG 3.
A 5.2-kb region of p0.1229_3 sufficient for Stx2a amplification harbors seven putative open reading frames. (A) Annotation of p0.1229_3 was performed by NCBI’s Prokaryotic Genomes Automatic Annotation Pipeline (PGAAP) as reported previously (15, 78). A Fur site preceding mctA was identified by the matrix-scan algorithm at the RSAT Prokaryotes Web server (75, 79). The map diagram was generated by SnapGene software (from GSL Biotech). (B) The mcc1229 region of p0.1229_3 was cloned into pBR322 and was sufficient to amplify Stx2a. Supernatants from the C600 strain alone or from the empty vector pBR322 did not amplify Stx2a. Deletions of mctA, mctB, and mctC abolished Stx2a-amplifying activity and could be complemented in trans. “E” denotes the empty complementation vector, pACYC124. Stx2a expression of PA2 exposed to filtered culture supernatants was determined by an ELISA as described in the text. Values that differed significantly from the mcc1229 supernatant are marked with asterisks (*, P < 0.05; **, P < 0.01). Statistical analysis was performed by one-way ANOVA with Dunnett’s multiple-comparison test. (C) mctABC form a transcriptional unit. Total RNA was extracted from 16-h-grown cultures of E. coli 0.1229 and converted to cDNA. PCR primers internal to the mctA, mctB, and mctC genes, depicted as half-arrows in panel A, amplified fragments indicative of a polycistronic transcript. Plasmid DNA (p0.1229_3) and a cDNA reaction without reverse transcriptase (RT) were used as positive and negative controls, respectively. “M” denotes the molecular marker, NEB’s 1-kb DNA ladder.

