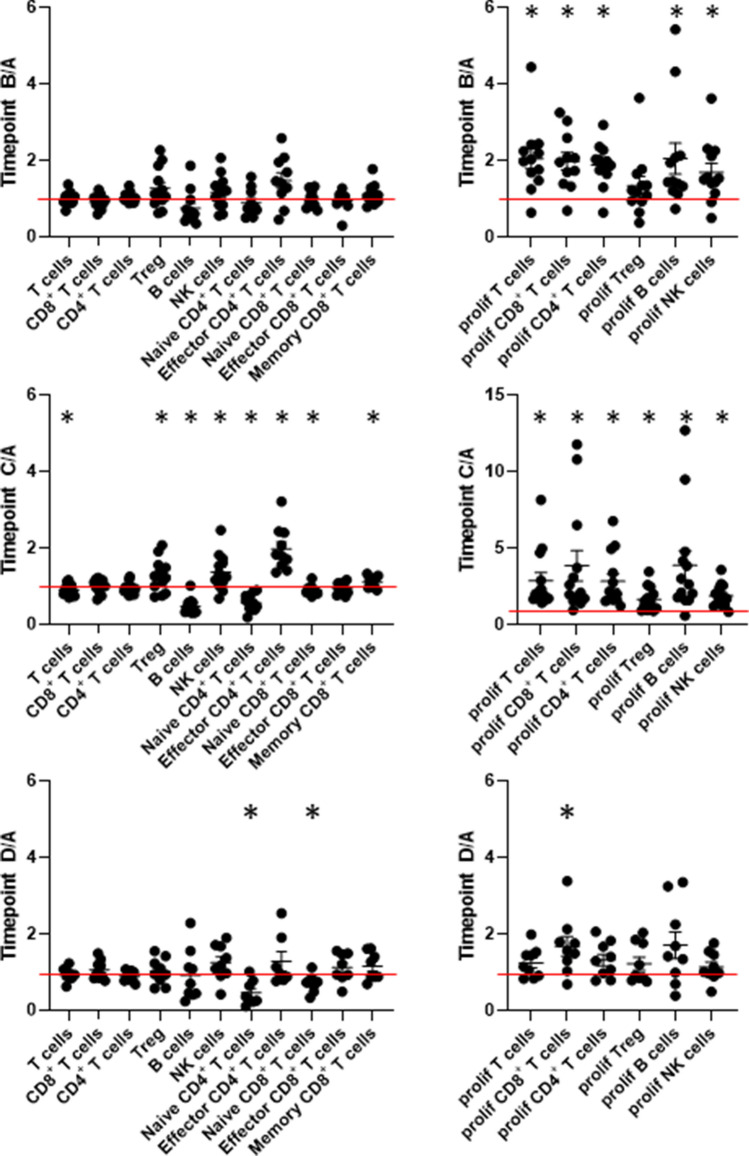
Fig. 1.
To compare immune cell changes with radiation planning parameters, the ratio of immune cell subsets and proliferative fractions within each of these cell subsets is displayed for time point B (4 weeks into radiotherapy), time point C (end of radiotherapy) and time point D (3 months after end of radiotherapy) compared to baseline levels (time point A). Significant changes have been observed for proliferation of most cell subsets at time point B, most subsets at time point C, and only a few long-lasting effects at time point D. The red line indicates a ratio of 1 and thus no change compared to baseline frequencies. * indicates significant changes with one sample t-test compared to a ratio of 1

