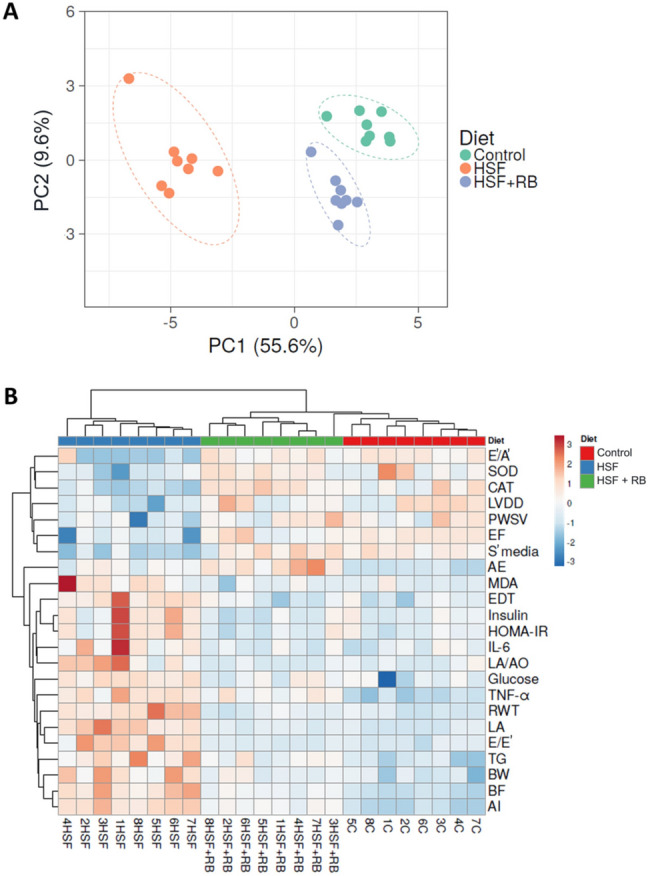
Fig. 6.

(A) Unsupervised multivariate principal component analysis (PCA) plot showing the multivariate variation among control, high-sugar fat (HSF), and high-sugar fat supplemented with rice bran (HSF + RB) diets in relation to all evaluated parameters. Each data point represents a sample, which is colored by the annotation of its diet type. (B) Hierarchical clustering analyses (Heatmap) using unsupervised Euclidean distance summarizes the effect of rice bran (RB) on the studied parameters of rats fed on a high-sugar fat diet (HSF). All evaluated parameters abbreviations are as defined in Fig. 5
