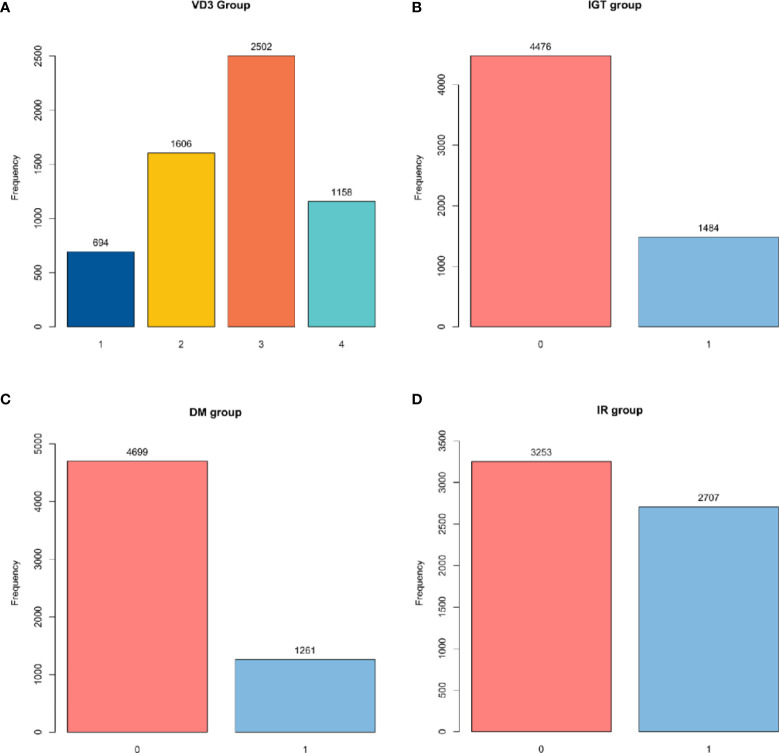
Figure 2.
Group diagram of each group. (A) Number of participants in different VD3 groups. (B) Number of participants with or without IGT. (C) Number of participants with or without DM. (D) Number of participants with or without IR. VD3, vitamin D3; IGT, impaired glucose tolerance; DM, diabetes mellitus; IR, insulin resistance.

