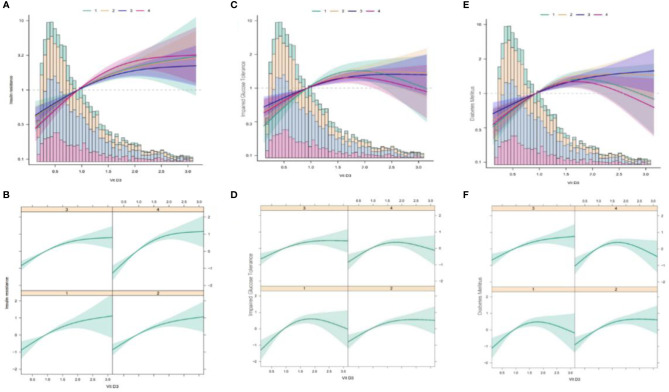
Figure 4.
Multivariate logistic regression analysis of the associations of TG/HDL ratio with IR, IGT, and DM in different VD3 groups. TG/HDL, triglycerides/high-density lipoprotein; IR, insulin resistance; IGT, impaired glucose tolerance; DM, diabetes mellitus; VD3, vitamin D3. (A) The association between TG/HDL and IR at different VD3 levels (Total). (B) The association between TG/HDL and IR at different vD3 levels (Separate). (C) The association between TG/HDL and IGT at different VD3 levels (Total). (D) The association between TG/HDL and IGT at different vD3 levels (Separate). (E) The association between TG/HDL and DM at different VD3 levels (Total). (F) The association between TG/HDL and DM at different VD3 levels (Separate). TG/HDL, triglycerides/high-density lipoprotein; IR, insulin resistance; VD3, vitamin D3; IGT, impaired glucose tolerance; DM, diabetes mellitus.

