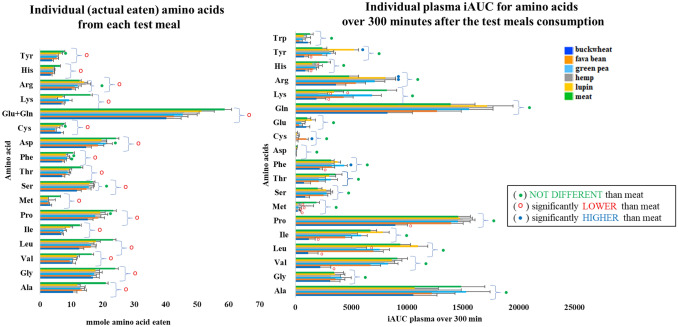
Fig. 3.
The average (n = 10 ± SEM) of individual amino acid eaten by the volunteers from the intervention meals and a statistical comparison (t test) of each amino acid from the individual plant-based meals vs meat meal (LEFT side). The plasma iAUC over 300 min for individual amino acids following consumption of test meals and a statistical comparison (ANOVA) of each amino acid from the individual plant-based meals vs meat meal (RIGHT side)

