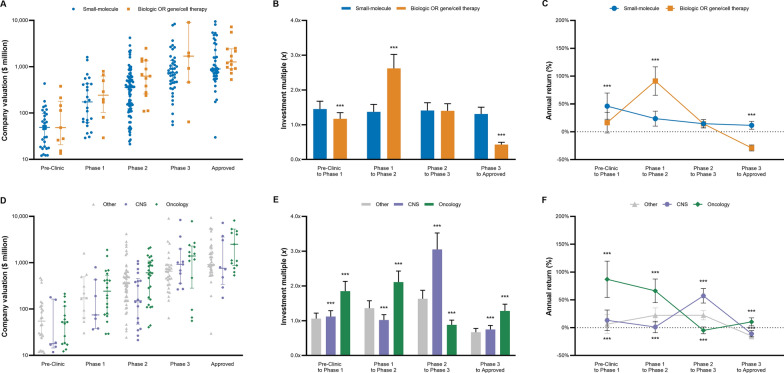
Fig. 2.
Company valuation, investment multiples, and annual returns by lead drug’s molecule type and disease area. Graphs in the first row compare the valuation (A), investment multiples (B), and annual returns (C) for companies with biologics or gene/cell therapies and small-molecule lead drugs by development stage. Graphs in the second row compare the valuation (D), investment multiples (E), and returns (F) for companies with lead drugs in oncology, CNS, and other disease areas by development stage. Valuation data from our sample of 311 Biopharma acquisitions (2005–2020) were inflation adjusted to 2020 values and combined with previously published success rates and development periods to calculate multiples and returns [11, 16]. The disease category other includes immunology, infectious disease, cardiovascular, dermatology, internal medicine, and ophthalmology. P values calculated based on ANOVA with Dunnett’s test (Sidak’s test for disease area): *p < 0.05, **p < 0.01, ***p < 0.001. CNS central nervous system

