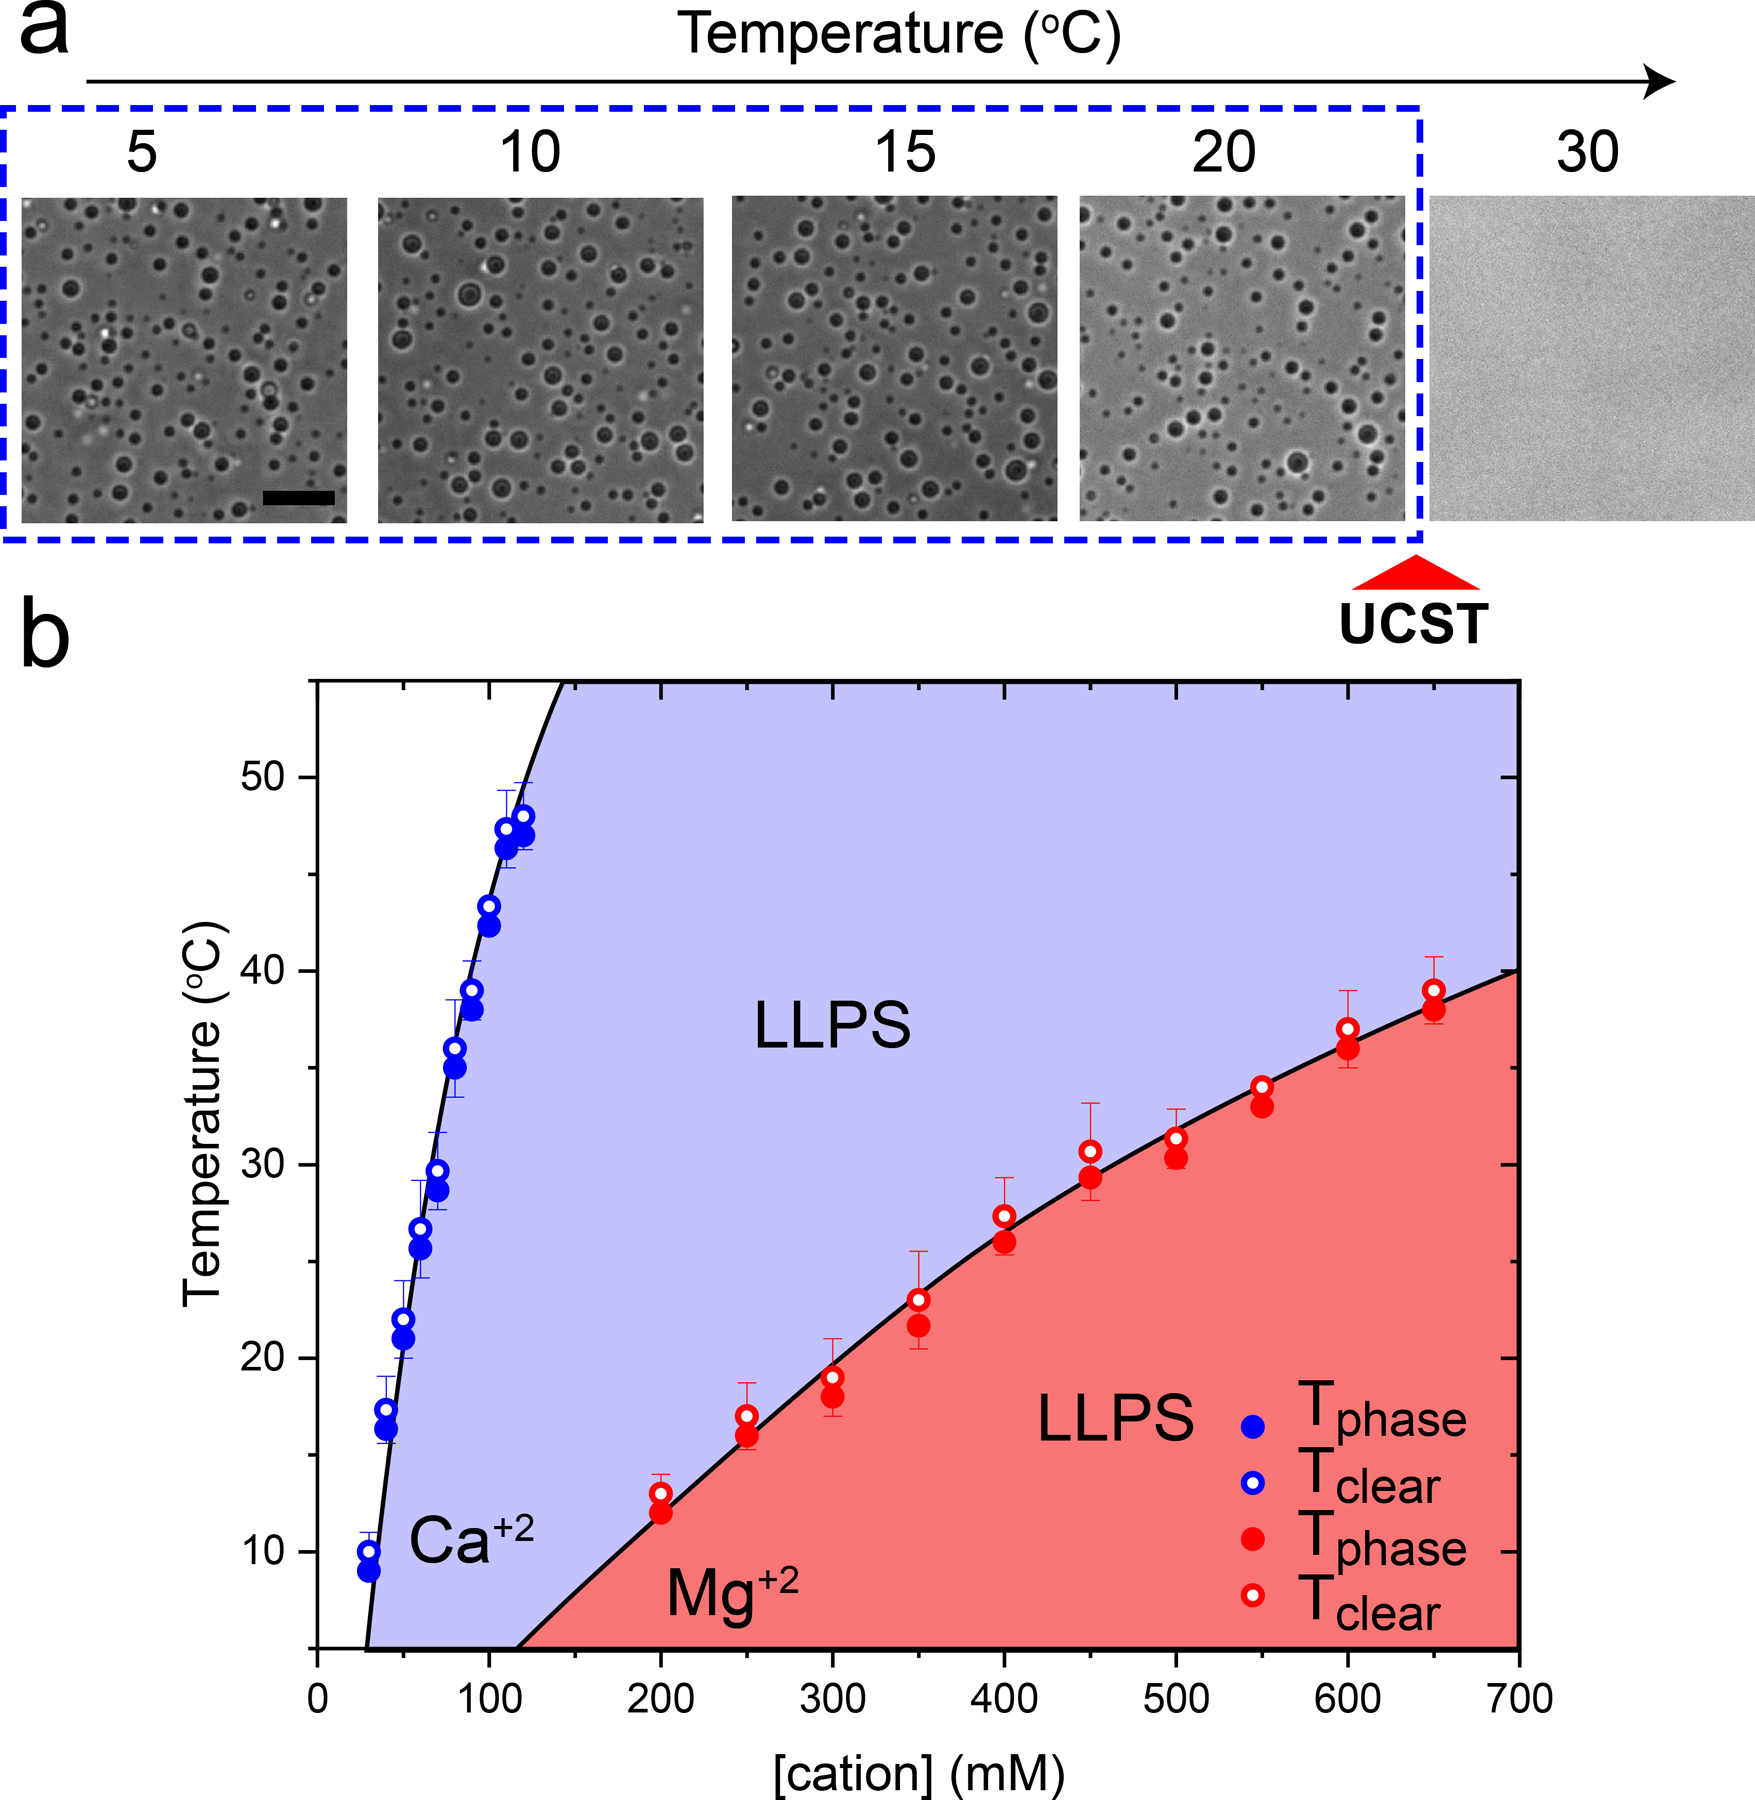
Figure 1. RNA-divalent cation mixtures display a UCST transition.

(a) Bright-field microscopy images of poly(rU)-Mg+2 mixtures at different temperatures showing a UCST transition. The Mg+2 concentration is 400 mM, poly(rU) concentration is 1.5 mg/ml, and the buffer contains 25 mM Tris-HCl (pH 7.5). Scale bar represents 10 µm. (b) A plot showing the dependence of phase separation temperature (Tphase, solid symbols) during cooling and transition back to a homogeneous mixture during heating (Tclear, open symbols) on the divalent cation concentration. Here, poly(rU) concentration was kept fixed at 1.5 mg/ml in 25 mM Tris-HCl buffer (pH 7.5). Shaded regions indicate the conditions where phase separation occurs. Solid lines are drawn as guides to the eye.
