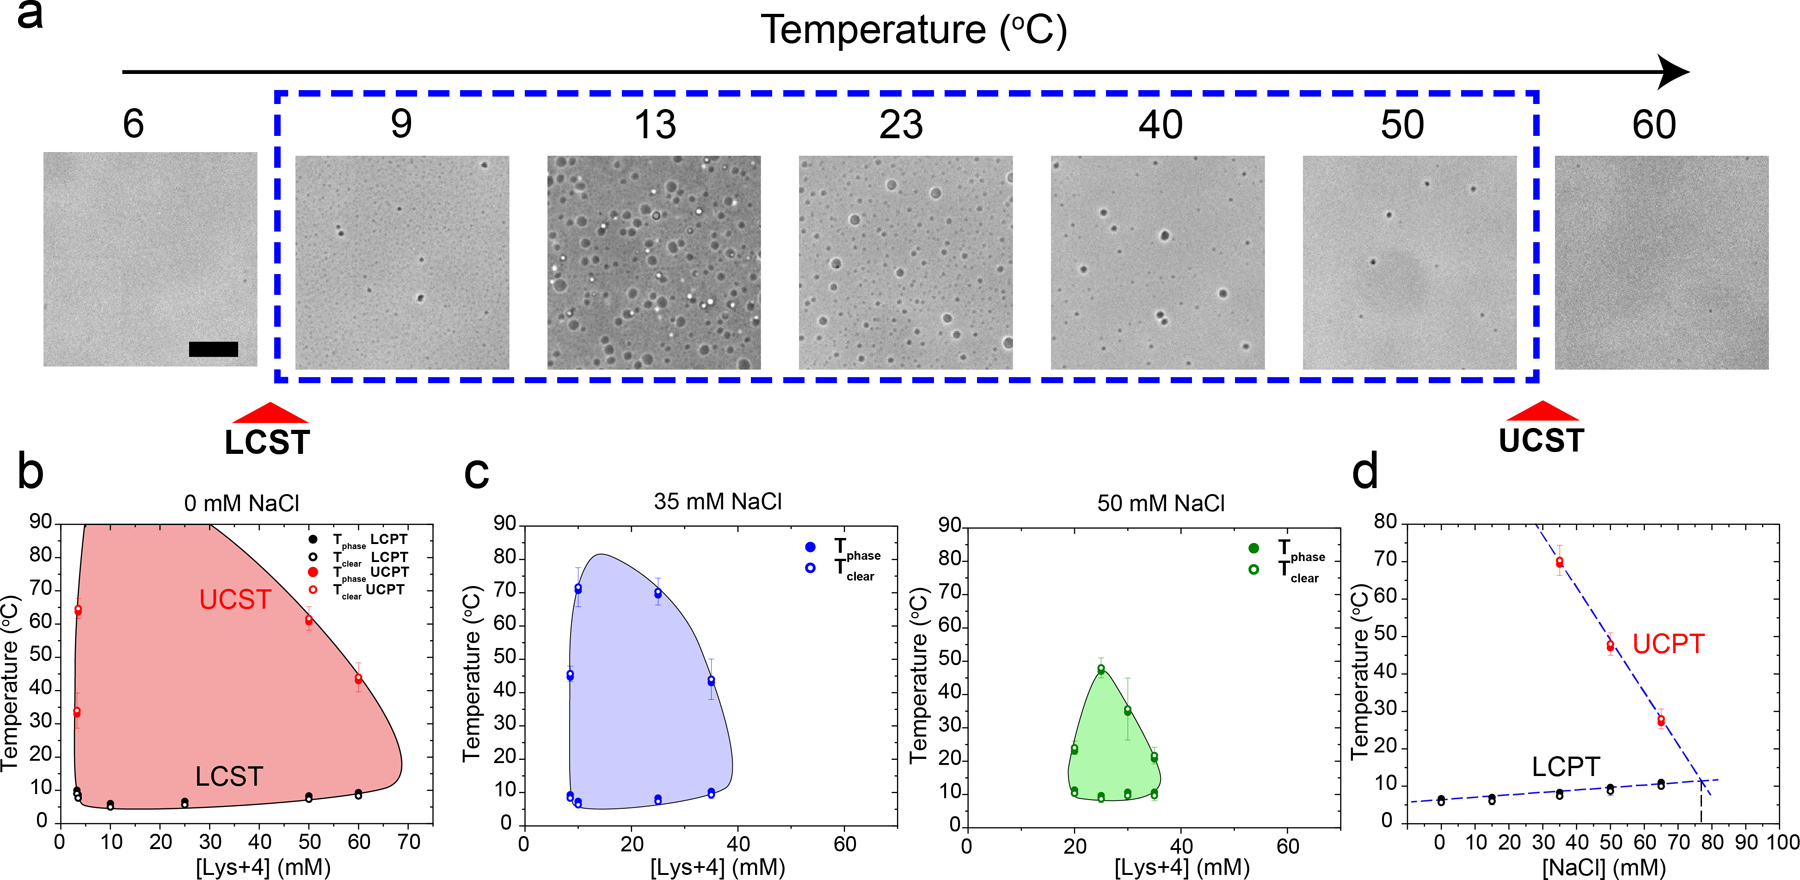
Figure 3. The closed-loop phase behavior of RNA-polycation mixtures is sensitive to the ionic strength of the buffer.

(a) bright field images of poly(rU)-Lys4 mixtures showing both LCST and UCST transitions. The poly(rU) concentration was 1.5 mg/ml and Lys4 concentration was 50 mM in a 25 mM Tris-HCl (pH 7.5) buffer. Scale bar represents 10 µm. (b) State diagram of poly(rU)-Lys4 mixtures at different Lys4 concentrations and temperature conditions. Solid symbols indicate temperatures of droplet formation (Tphase) and open symbols indicate temperatures of droplet dissolution (Tclear). Here, poly(rU) was kept at 1.5 mg/ml concentration in 25 mM Tris-HCl buffer (pH 7.5). (c) Same data as in (b) but with 35 mM NaCl (left) or 50 mM NaCl (right) added to the buffer. (d) The upper and lower cloud-point temperatures (UCPT and LCPT, respectively) were measured as a function of salt concentration. Samples were prepared at 1.5 mg/ml poly(rU) and 25 mM Lys4 in a buffer containing 25 mM Tris-HCl (pH 7.5) and variable salt conditions. Shaded regions in b&c indicate the conditions where phase separation occurs. Solid lines are drawn as guides to the eye.
