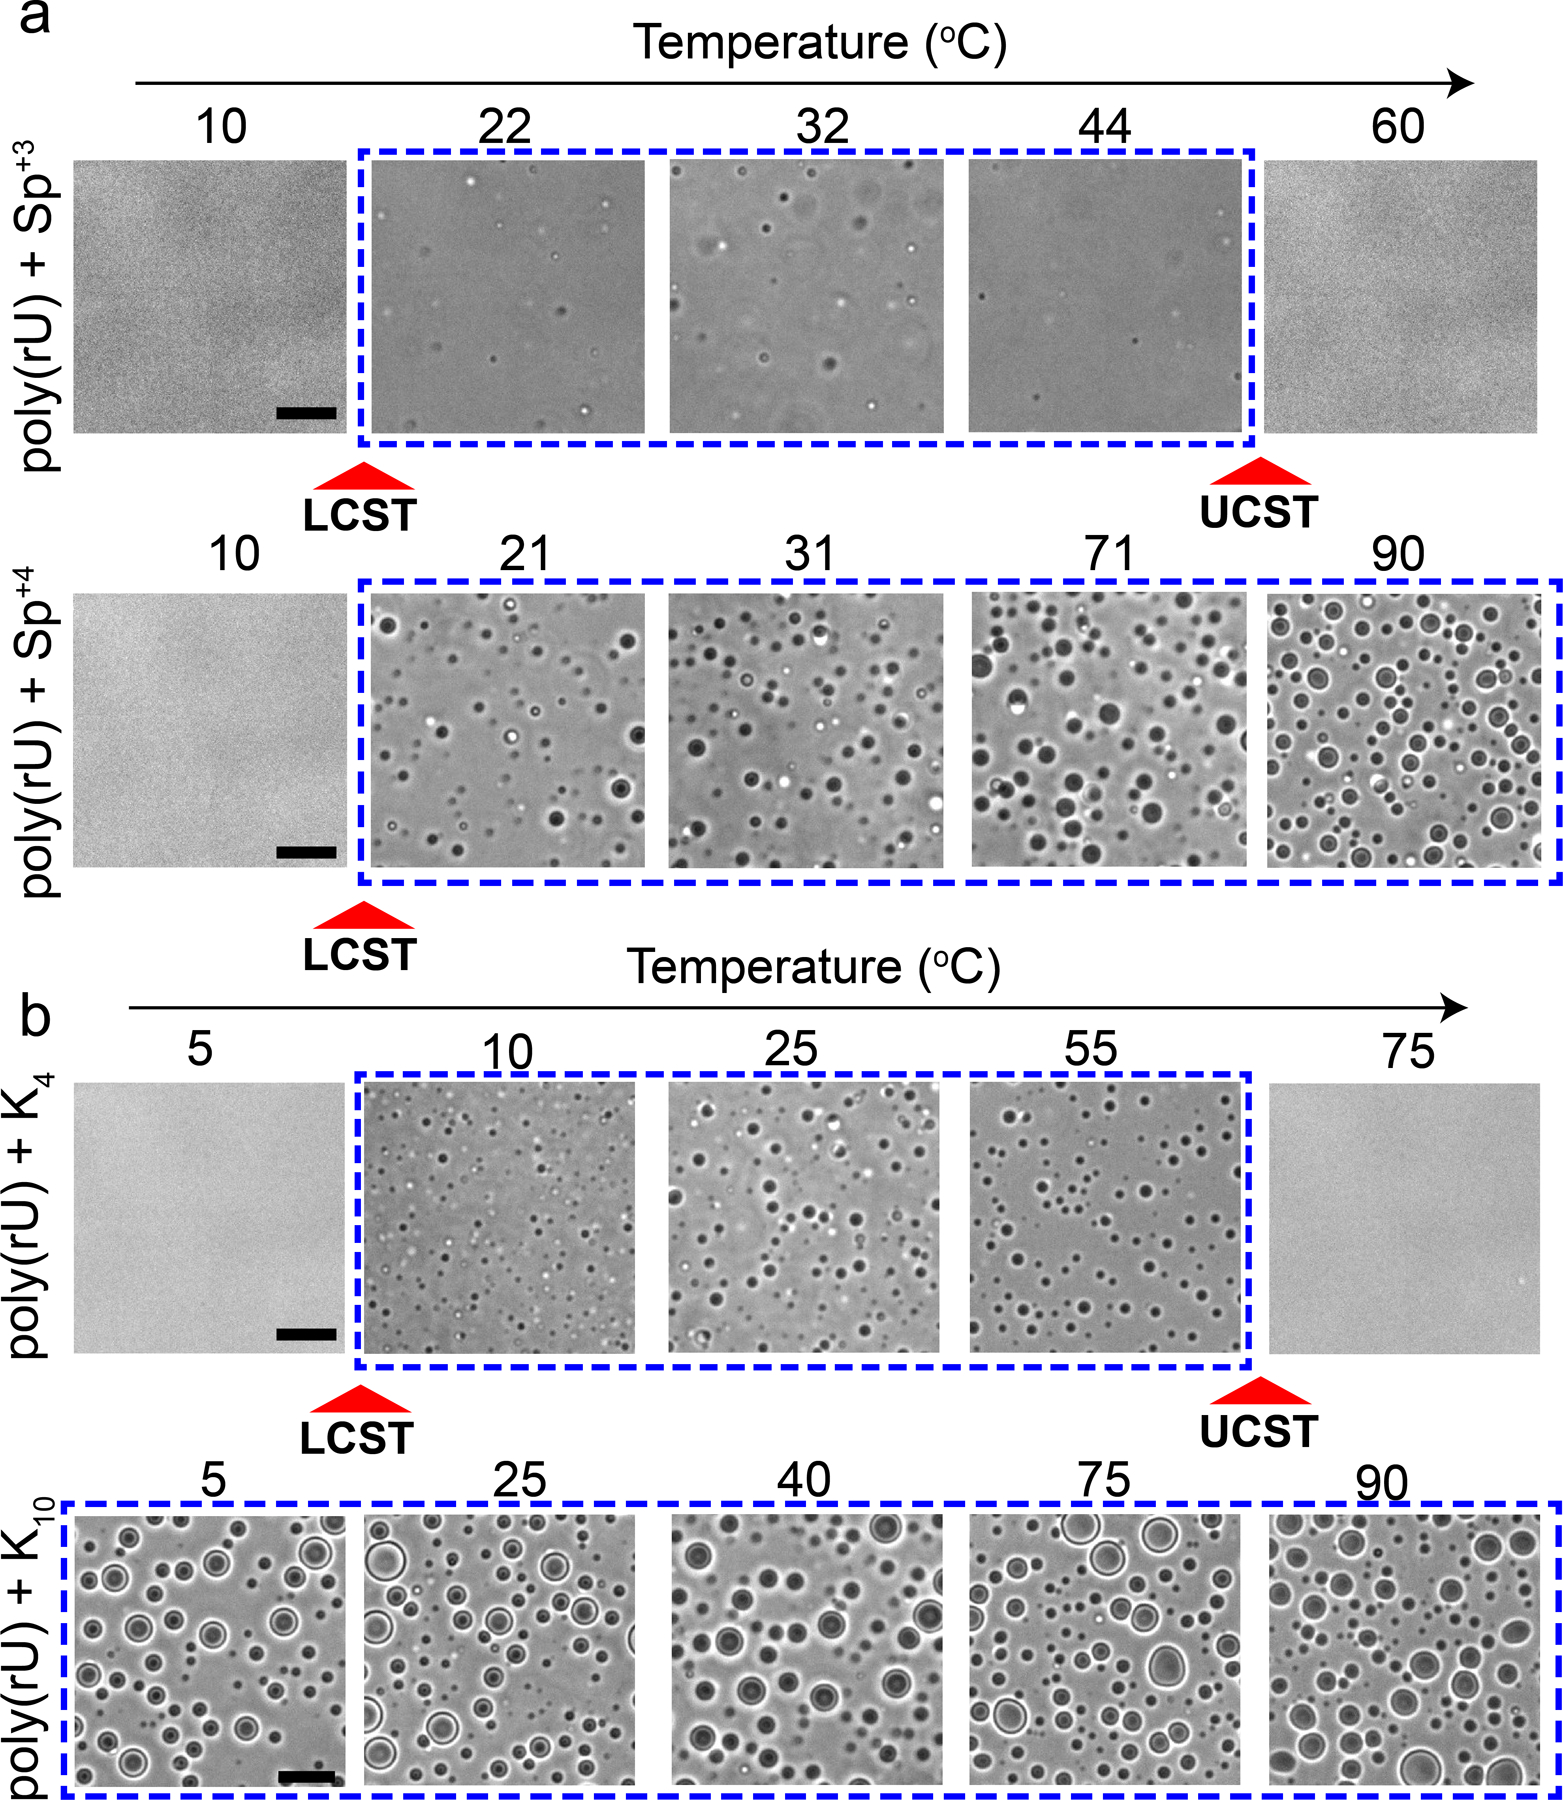
Figure 4. Polycation charge and/or size strongly affect both LCST and UCST transitions.

(a) Bright-field microscopy images of poly(rU)-spermidine mixtures (top) and poly(rU)-spermine mixtures (bottom) at different temperatures. Spermidine-poly(rU) sample showed both LCST and UCST transitions. The poly(rU) concentration was 1.5 mg/ml and spermidine concentration was 25 mM in a 25 mM Tris-HCl (pH 7.5) buffer. The spermine concentration was chosen to be 18.75 mM to keep an identical charge concentration. The spermine-poly(rU) sample showed an LCST transition but did not show a UCST transition within the same temperature range. (b) Bright-field microscopy images of poly(rU)-Lys4 mixtures (top; [K4] = 50 mM) and poly(rU)-K10 mixtures (bottom; [K10] = 20 mM) at different temperatures. Both samples contain identical charge concentrations of the respective polycations. All scale bars represent 10 µm.
