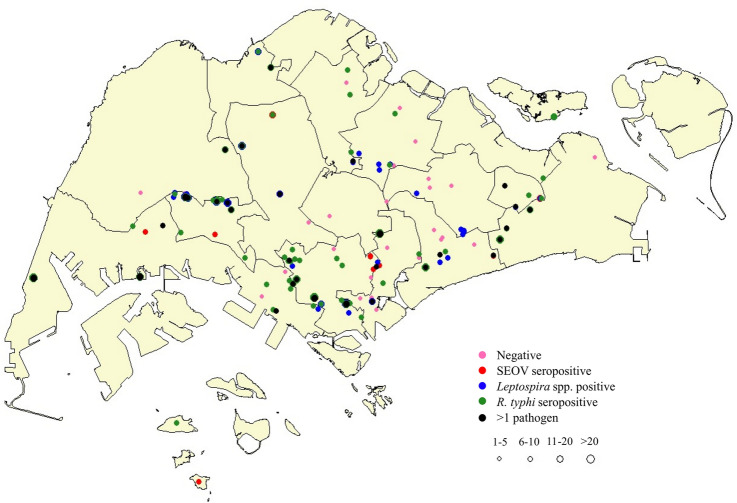
Figure 1.
Spatial distribution of rodent trappings and prevalence of pathogens in R. norvegicus and R. rattus in Singapore, 2006–2008. Demarcations represent town councils.  : rodents with no infection;
  : rodents seropositive for SEOV;
  : rodents positive for Leptospira spp.;
  : rodents seropositive for R. typhi;
  : rodents positive for more than one type of pathogen. The number of rodents trapped was reflected by the size of the circle. Abbreviations: SEOV, Seoul hantavirus.
Map created using the Free and Open Source QGIS. QGIS.org, 2021. QGIS 2.18.25. Geographic Information System. QGIS Association. http://www.qgis.org.

