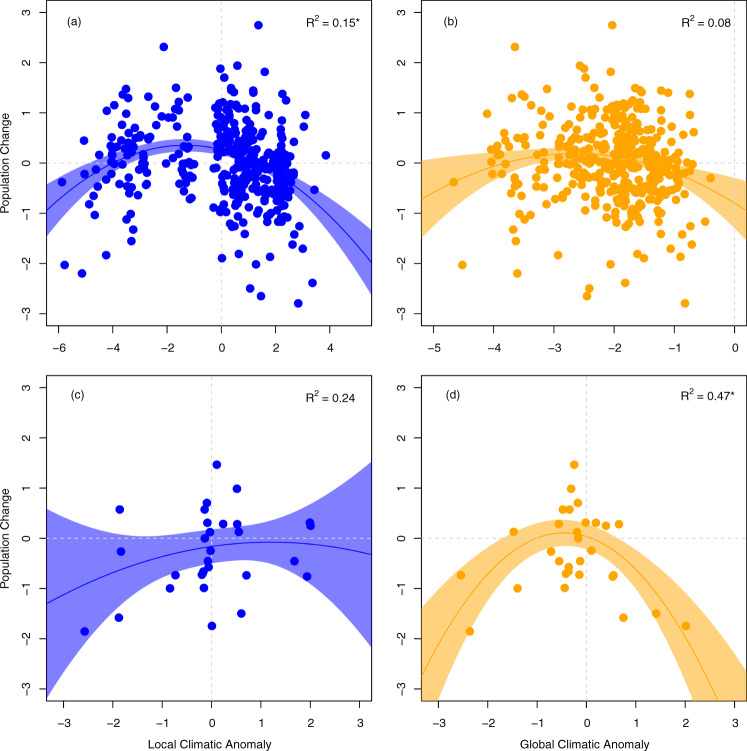
Fig. 3. Population change in relation to local and global climatic anomalies.
a, b show local and global responses, respectively, for Brenthis ino, a species best adapted to local climatic anomalies in temperature during the overwintering period of the previous year of their adult stage (t − 1). c, d show local and global adaptation for Cupido osiris, a species whose population dynamics are best explained by global climatic anomalies in aridity during the pre-flight period of the year of their adult stage (t), indicating a lack of local adaptation. Colors indicate spatial scale (blue, local; orange, global), circles indicate raw data, lines show predicted trend with 95% confident intervals, asterisks indicate the best model for each species.

