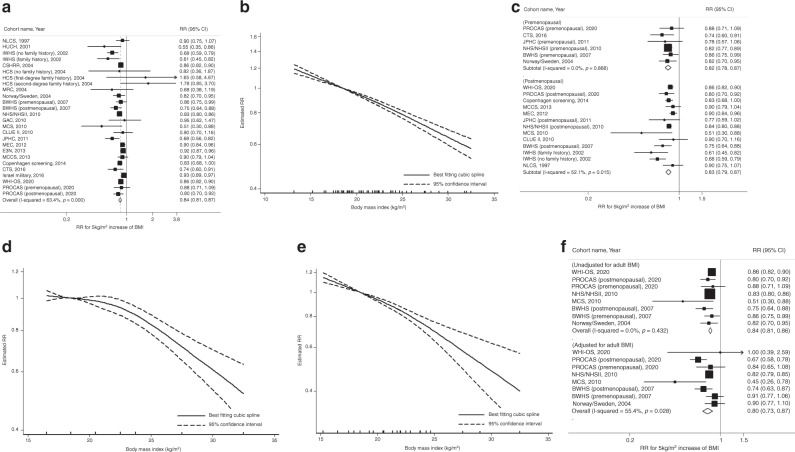
Fig. 1. Linear and nonlinear dose–response relationships for early-life BMI and breast cancer risk.
This figure shows the results from a linear dose–response relationship with total breast cancer; b nonlinear dose–response relationship with total breast cancer (p-nonlinearity = 0.19); c subgroup analysis by menopausal status (p-heterogeneity = 0.78); d nonlinear dose–response relationship with premenopausal breast cancer (p-nonlinearity = 0.004); e nonlinear dose–response relationship with postmenopausal breast cancer (p-nonlinearity = 0.16); f subgroup analysis by adjustment for adult BMI (p-heterogeneity = 0.36). The black squares and horizontal lines represent study-specific relative risks and their 95% confidence intervals. The area of each black square reflects the weight each study contributes to the meta-analysis. The middle and horizontal tips of diamonds represent summary RRs and their 95% confidence intervals, respectively. The P values were calculated from Cochran’s Q test; all statistical tests were two-sided.

