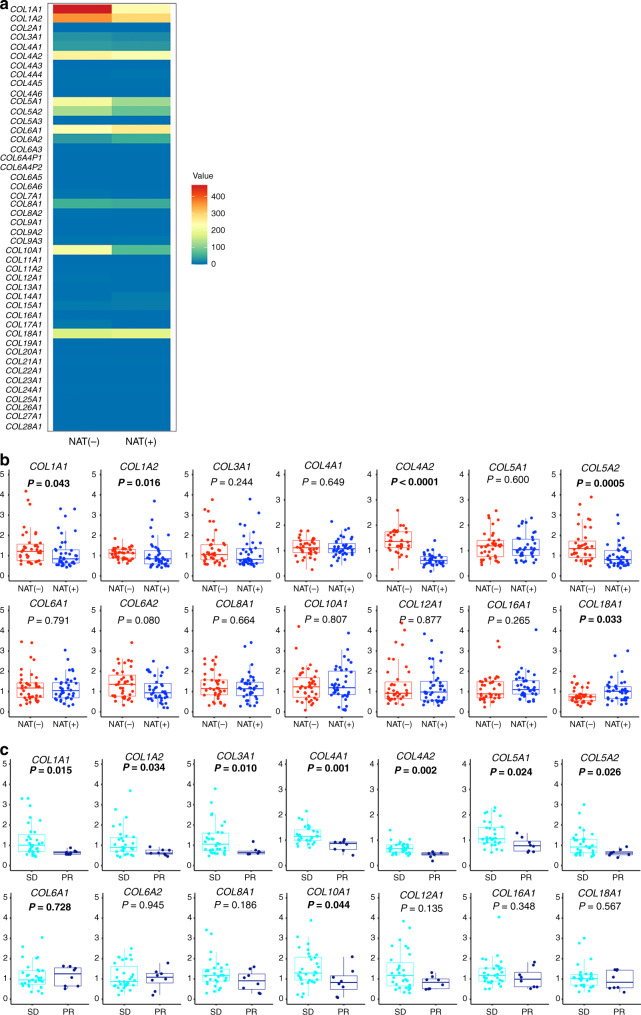
Fig. 2. Alteration of collagen gene expression following neoadjuvant therapy (NAT).
a Transcriptional distribution of collagen gene profiles with effective NAT or without NAT. The heatmap shows the comparison of normalised/averaged values from COL1A1 to COL28A1 between four patients without NAT and four patients with NAT. b, c Collagen genes that are positively expressed in PDAC tissue (value of more than 50 in microarray data) or related to type I–V collagens are analysed using qRT-PCR analysis. The relative gene expression is compared between PDAC tissue with effective NAT (n = 39) and that without NAT (n = 39) (b), and between patients exhibiting SD after NAT (n = 31) and those exhibiting PR after NAT (n = 8) (c). Box plots and the scatter plots are combined. Whisker heights extend to 1.5 times the height of the box or, if no case/row has a value in that range, to the minimum and maximum values. The horizontal lines within the box indicate the median values. Differences were analysed by using Mann–Whitney U test. Bold letter indicates statistical significance.

