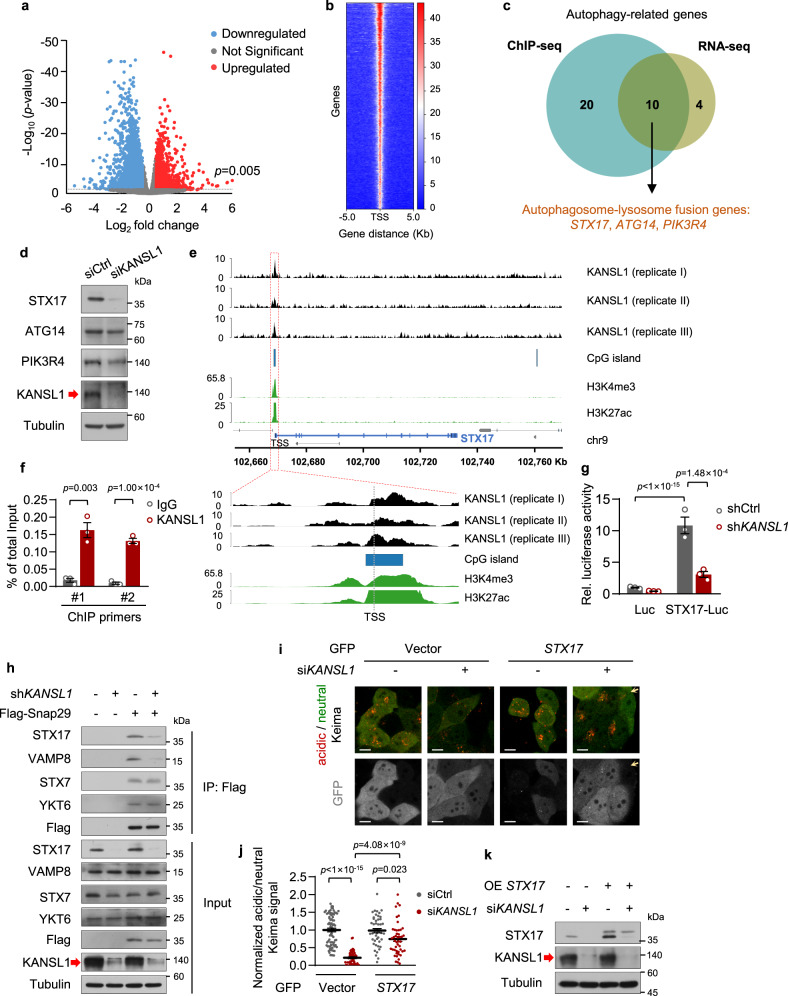
Fig. 3. KANSL1 modulates autophagosome-lysosome fusion progress via transcriptional regulation of STX17.
a Volcano plot showing differentially expressed genes (DESeq2 adjusted p < 0.005; Log2 fold change <−0.5 or >0.5) in Kansl1fl/fl/CAG-cre compared to Kansl1fl/fl MEFs (n = 3 mice in each group). b A heatmap of input-normalized ChIP peaks for KANSL1. Each peak of gene is represented as a horizontal line. One representative of three independent experiments is shown. c Venn diagram showing KANSL1 targeted autophagy-related genes by integrated ChIP-seq and RNA-seq data in (a, b). d Western blot analysis of HeLa cells transfected with siRNAs with the indicated antibodies. The arrow indicated the KANSL1 protein band. e pyGenomeTracks representing input-normalized KANSL1 ChIP-seq signal around STX17. ChIP-seq datasets for H3K4me3, H3K27ac, and CpG island are taken from public databases. f ChIP-qPCR analysis with KANSL1 antibody showing the enrichment of KANSL1 at the promoter of STX17 with two different primers in HeLa cells (n = 3 technical replicates). The experiment has been replicated for three times with a similar result. g Luciferase assay of HeLa cells expressing pGL4.19-STX17 promoter. n = 3 independent experiments. h Western blot analysis of co-immunoprecipitation of the Flag-Snap29 in HeLa cells infected with indicated shRNAs lentivirus and cultured in EBSS for 2 h. i Keima imaging (neutral signal in green; acid signal in red) in HeLa cells transfected with KANSL1 siRNA and indicated T2A-GFP-tagged plasmids after 12 h EBSS treatment. Gray signals correspond to cleaved GFP. Arrows indicate STX17-T2A-GFP-uninfected cells. Scale bar, 10 μm. j Quantification of acidic/neutral Keima signal in (i). Cells number was obtained from microscopy calculated for 46 to 74 from independent experiments. Acidic/neutral Keima signal in control cells was normalized to ‘1’. k Western blot analysis of HeLa cells transfected with the indicated siRNAs and infected with lentivirus expressing GFP or GFP-STX17, where the GFP was cleaved off in cells, as in (i). Source data are provided as a Source data file. All data are means ± SEM. f Two-tailed Student’s t-tests; g by one-way ANOVA with Dunnett’s multiple hoc test.

