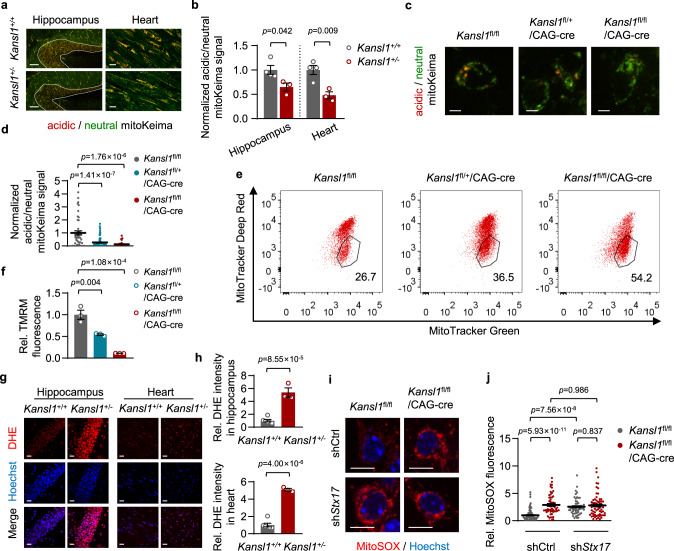
Fig. 5. Kansl1+/− mice exhibit accumulated damaged mitochondria and elevated ROS levels.
a mitoKeima signal in the hippocampus and heart of Kansl1+/+ and Kansl1+/− mice. The neutral mitoKeima signal is excited at 458 nm (green) and the acid mitoKeima signal is excited at 561 nm (red). White lines outline hippocampus regions. Scale bar, 120 μm (hippocampus), 25 μm (heart). b Quantification of acidic/neutral mitoKeima signal in (a). The mitoKeima signal in WT was normalized to ‘1’. n = (4 Kansl1+/+ mice and 3 Kansl1+/− mice). c mitoKeima imaging (neutral signal in green; acid signal in red) in primary neurons treated with tamoxifen (1 μM, 5 days). Scale bar, 5 μm. d Quantification of mitoKeima signal of cells in (c). The acidic/neutral mitoKeima signal in WT cells was normalized to ‘1’. n = 46, 76, 27 from left to right. e Representative FACS plots showing analysis of primary neurons treated with tamoxifen (1 μM, 5 days). Cells were stained with MitoTracker Green and MitoTracker Deep Red at 7 DIV. f Quantification of TMRM median intensity by flow cytometry. Primary neurons were treated with tamoxifen (1 μM, 5 days) staining with TMRM. TMRM intensity of WT is normalized to ‘1’ (n = 3 mice in each group). g Representative fluorescence images of hippocampal CA1 regions and hearts with DHE (red). Nuclei are labeled with Hoechst (blue). Scale bar, 20 μm. h Quantification of DHE intensity in (g). DHE intensity in Kansl1+/+ was normalized to ‘1’. n = (6 Kansl1+/+ mice and 3 Kansl1+/− mice). i Representative confocal images of MitoSOX in primary neurons treated with tamoxifen (1 μM, 5 days). Cells were infected with the indicated lentivirus expressing the shRNAs. Scale bar, 10 μm. j Quantification of MitoSOX intensity in (i). MitoSOX intensity of WT is normalized to ‘1’. n = 102, 55, 56, 66 from left to right. Source data are provided as a Source data file. All data are means ± SEM. b, h Two-tailed Student’s t-tests; d, j by one-way ANOVA with Tukey’s multiple hoc test; f by one-way ANOVA with Dunnett’s multiple hoc test.

