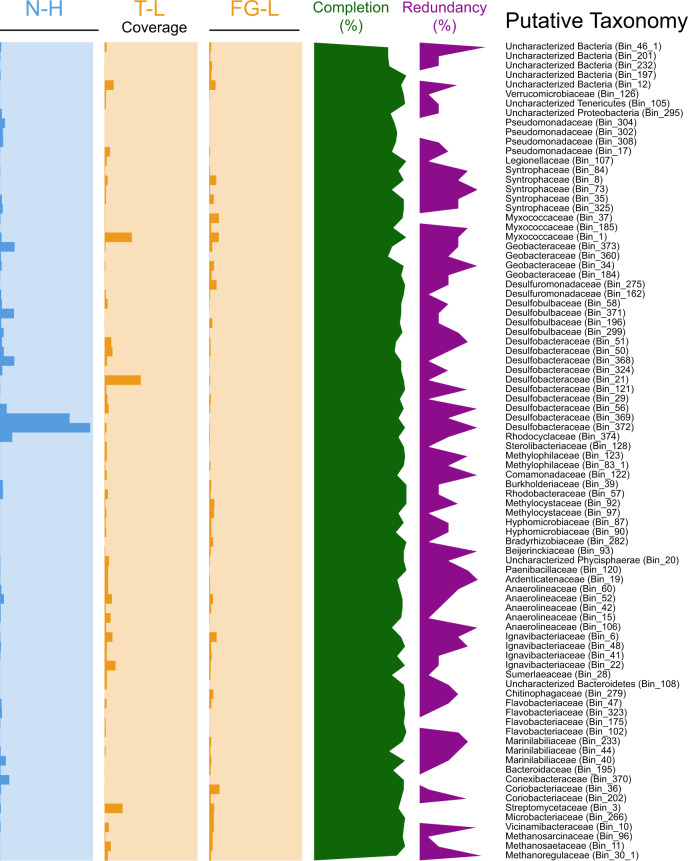
Fig. 2. Coverage comparison of individual metagenome-assembled genomes (MAGs).
MAGs with greater than 80% completion (green line graph; axis from 0–100%) from one high-sulfate coal seam (N-H in blue) and two low-sulfate coal seams (FG-L and T-L in orange) were compared. Coverage is calculated by finding the average depth of coverage across all contigs using Anvi’o compiled contigs. Coverage bar graphs axis (from 0 to 550×) is indicated with the highest possible sequencing depth being 550. All samples were below 10% redundancy (purple line graph; axis 0–10%). Taxonomies are listed based on phylum.

