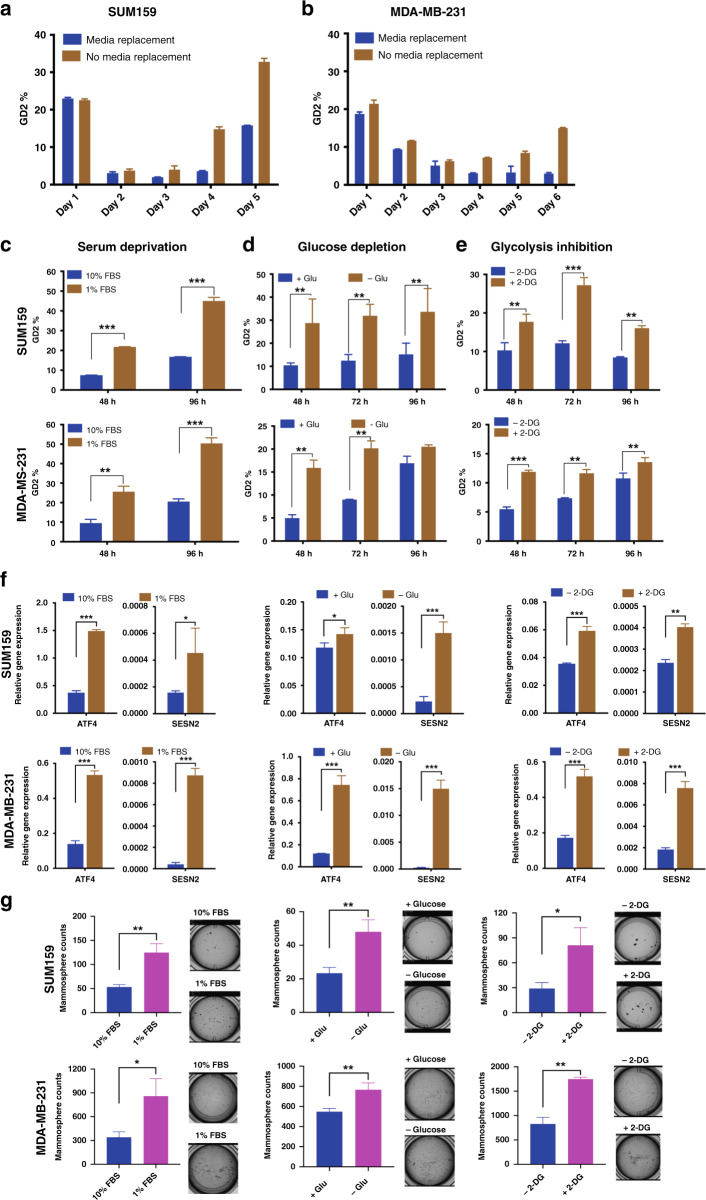
Fig. 1. Serum and glucose deprivation induces GD2 expression in TNBC.
a, b SUM159 (50,000 cells/well) or MDA-MB-231 (75,000 cells/well) cells were plated in 24-well plates and maintained with or without replacing the cell culture media after initial seeding. GD2 expression was analysed using flow cytometry with APC-conjugated anti-GD2 antibody at 24-h intervals. c SUM159 and MDA-MB-231 cells were grown in cell culture media supplemented with either 1 or 10% FBS for 24 and 48 h. d For glucose deprivation, SUM159 and MDA-MB-231 cells were grown in dialysed FBS supplemented with or without glucose for 48, 72 and 96 h. e For glycolysis inhibition, SUM159 and MDA-MB-231 cells were grown in 10% FBS with or without 2-DG (10 mM) for 48, 72 and 96 h. GD2 expression was analysed using flow cytometry after every time point as indicated. f Gene expression of stress markers (ATF4 and SESN2) in SUM159 and MDA-MB-231 cells cultured under serum deprivation, glucose depletion and glycolysis inhibition for 48 h. g Mammosphere formation from the cells cultured under serum deprivation, glucose depletion and glycolysis inhibition. Two-way ANOVA followed by Sidak’s post hoc multiple comparison test was performed for GD2 expression between the treatment groups. ***p = 0.001, **p = 0.002 and *p = 0.033. An unpaired t test was performed to calculate the significance for gene expression of stress markers and mammosphere counts; ***p = 0.001, **p = 0.002 and *p = 0.033.

