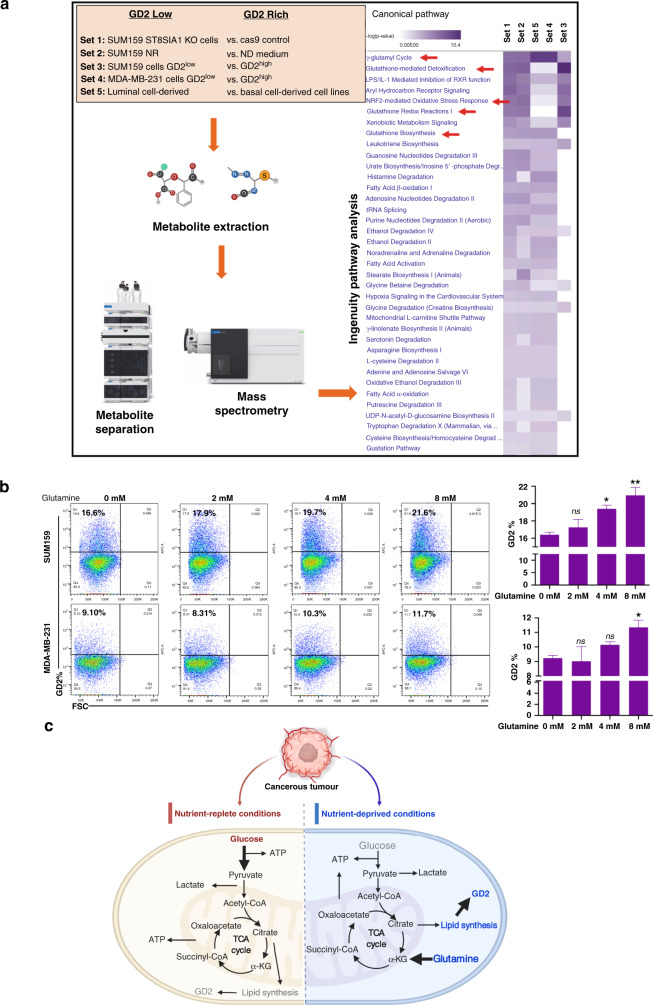
Fig. 2. Metabolomic profiling of breast cancer stem cells.
a TNBC cell lines MDA-MB-231 and SUM159 were subjected to different conditions, and metabolomics profiling of >300 metabolites was performed using a mass spectrometry-based assay. The resulting data were analysed in five different sets as shown and described in ‘Materials and methods’. Samples were subjected to metabolite extraction followed by purification and mass spectrometry analysis. The elevated pathways were identified using Ingenuity Pathway Analysis. b Glutamine regulates GD2 expression in TNBC cells. TNBC cell lines SUM159 (3 × 10⁵/well) and MDA-MB-231 (4.5 × 10⁵/well) in 12-well plates were cultured with increasing concentrations of l-glutamine (0, 2, 4 and 8 mM) for 72 h and GD2 expression was measured by flow cytometry. One-way ANOVA followed by Dunnett’s post hoc multiple comparison test was performed for GD2 expression, taking untreated cells as the control. **p = 0.006, *p < 0.05 and n.s. not significant. c Illustration of nutrient-replete and nutrient-deprived conditions regulating GD2 expression. The left-side panel represents glucose-rich conditions (bold arrow) to maintain an optimal level of GD2 in a stress-free environment. The right-side panel depicts glucose depletion in metabolic stress conditions leading to an upregulation of GD2 expression by utilising the glutamine-mediated pathways (bold arrow). Grey colour represents low levels and blue represents higher levels of metabolites.

