FIGURE 2.

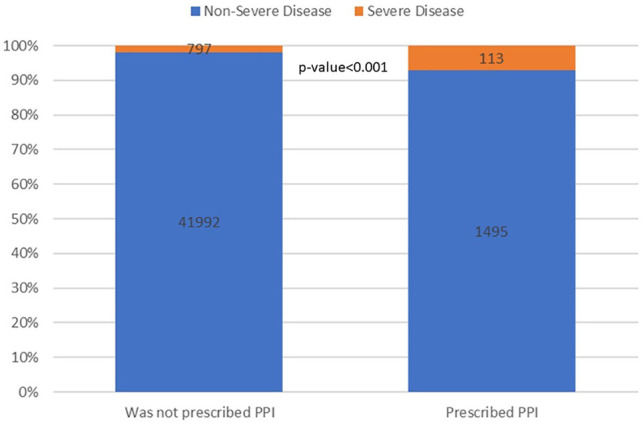
PPIs and COVID-19 severity. The numbers on the bars represent the number of patients in each sub-category, whereas the inner partition into orange and blue represents the conditional distribution of severity.

PPIs and COVID-19 severity. The numbers on the bars represent the number of patients in each sub-category, whereas the inner partition into orange and blue represents the conditional distribution of severity.