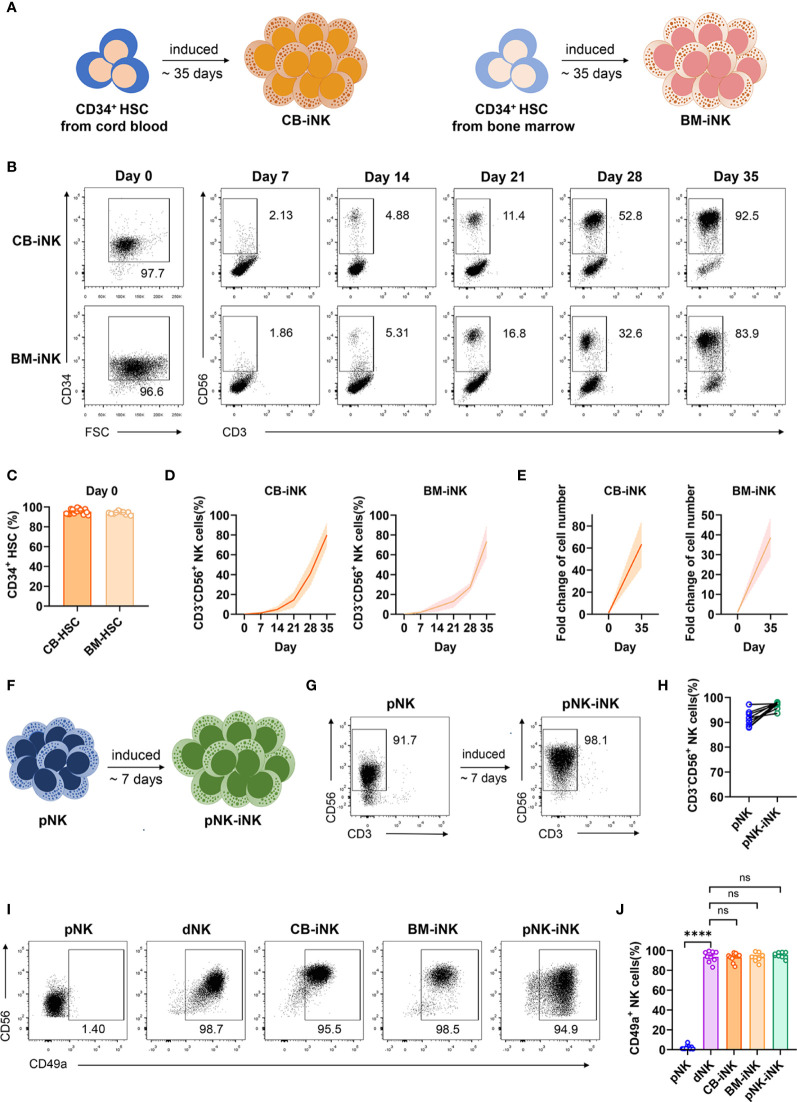
Figure 1.
Inducing human CD49a+ NK cells from three different sources. (A) Schematic diagram of CB-iNK cells (left) and BM-iNK cells (right) acquired from HSCs. (B) Representative density plots of CD34+ cells sorted from cord blood or bone marrow mononuclear cells, and flow cytometric analysis of the percentage of CD3-CD56+ NK cells in the system on days seven through thirty-five. (C) Statistical analysis of CD34+ HSCs purity after MACS sorting. (D, E) Flow cytometry analysis of frequency (D) and absolute number (E) for CD3-CD56+ NK cells on day 35 of culture. (F) Schematic diagram of pNK-iNK cells acquired from purified pNK cells. (G) Representative density plots of CD3-CD56+ pNK cells and pNK-iNK cells. (H) Statistical analysis of CD3-CD56+ NK cells. (I, J) The percentage of CD3-CD56+ NK cells that expressed CD49a in each group was tested by flow cytometry. Representative density plots (I) and statistical calculation of all samples (J). Data was analyzed by one-way ANOVA. Data represent means ± SD, n ≥ 6 in each group. ****p < 0.0001; ns, not significant.

