Figure 2.
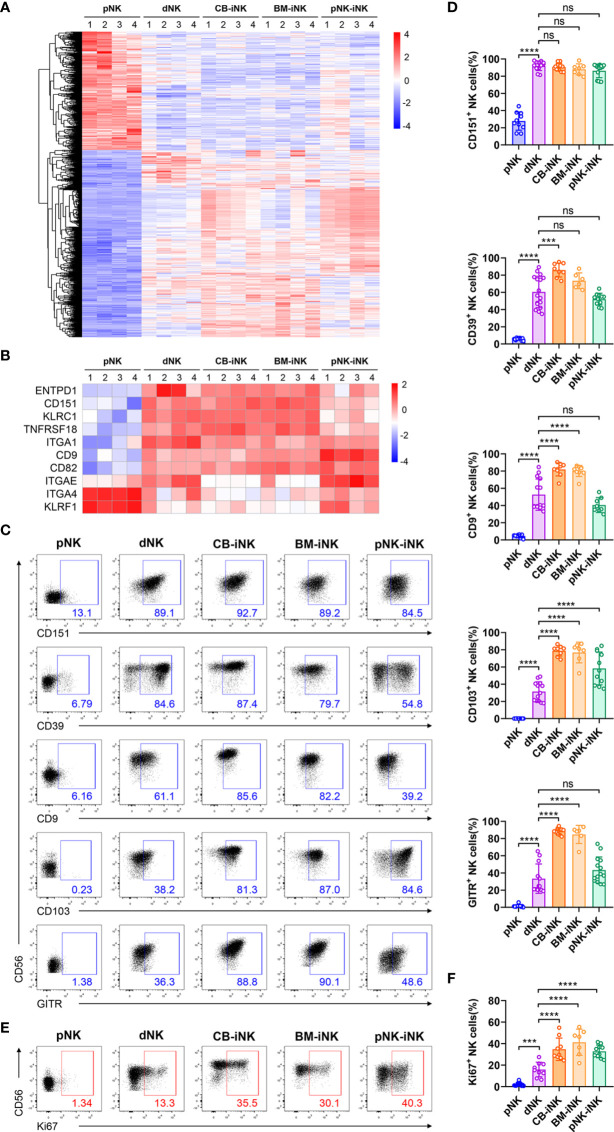
Phenotypic and proliferation potential analyses of iNK cells. (A) The 1116 common differentially expressed genes (DEGs) (fold change > 2 and pvalue < 0.05) of pNK cells compared with other NK cells were selected for heat map analysis. Each column represents one sample (n = 4 per group). (B) Some genes encoding phenotypic markers of dNK cells were selected for heat map analysis. Each column represents one sample (n = 4 per group). (C, D) The percentage of NK cells that expressed dNK-phenotypic markers and inhibitory receptors in each group was obtained via flow cytometry. Representative density plots (C) and statistical calculation of all samples (D). (E, F) The percentage of NK cells that expressed Ki67 in each group was performed by flow cytometry. Representative density plots (E) and statistical calculation of all samples (F). Data were analyzed by one-way ANOVA. Data represent means ± SD, n ≥ 6 in each group. ***p < 0.005; ****p < 0.0001; ns, not significant.

