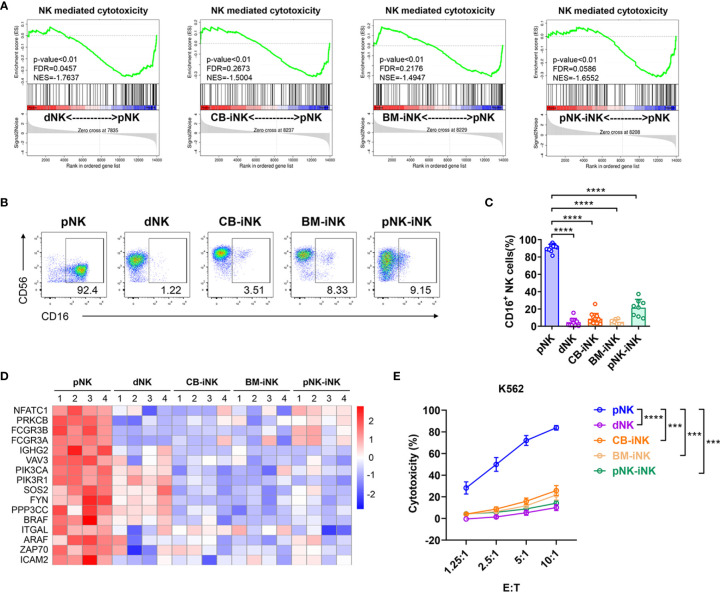
Figure 3.
Cytotoxic capability detection of iNK cells. (A) Gene set enrichment analysis (GSEA) revealed an increase in Natural Killer cell-mediated cytotoxicity (enrichment plot: NATURAL KILLER CELL MEDIATED CYTOTOXICITY, HSA04650) in pNK cells compared with dNK cells and three kinds of iNK cells (n = 4 per group). (B, C) The percentage of CD16+ NK cells in each group was tested by flow cytometry. Representative density plots (B) and statistical calculation of all samples (C). Data represent means ± SD. (D) Some of the NK cells mediated cytotoxicity-related genes were selected for heat map analysis (n = 4 per group). (E) The direct cytotoxicity of different NK cells toward K562, as measured by flow cytometry. Results are presented as the mean ± SEM. Data were analyzed by one-way ANOVA, and n ≥ 6 in each group (C, E). ***p < 0.005; ****p < 0.0001.

