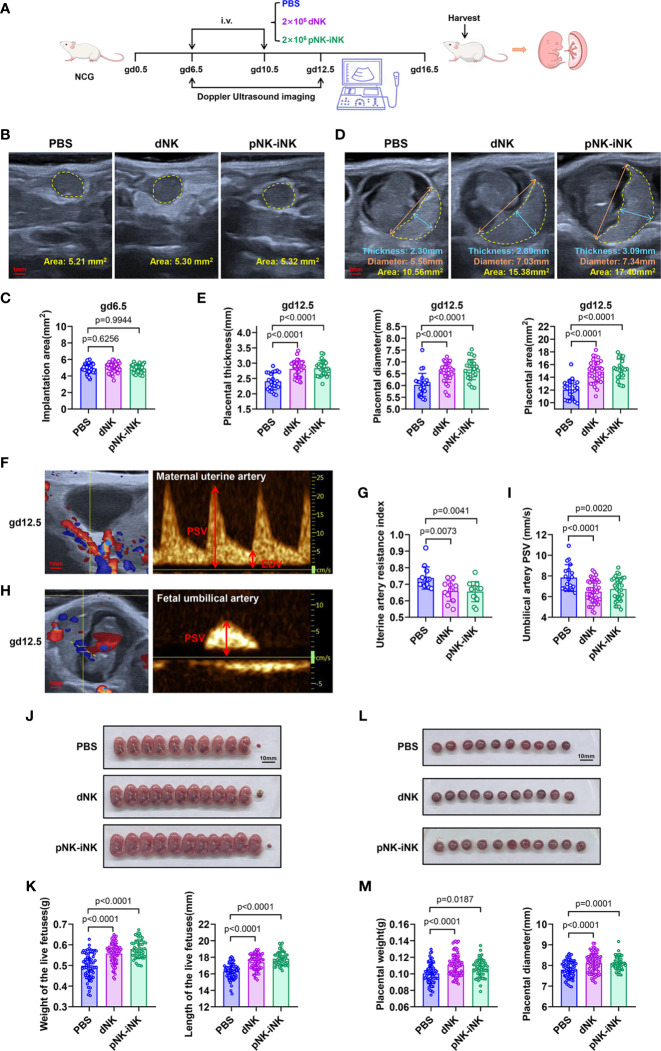
Figure 5.
Adoptive transferred pNK-iNK cells promote fetal growth. (A) Schematic diagram of adoptive transferring pNK-iNK cells in pregnancy mice model, n=6 pregnancy mice per group. The experiment was performed twice and the results were shown only once. (B, C) Implantation areas of pregnancy mice before being transferred cells at gd6.5. Bar, 1 mm. Representative ultrasound images from the three groups (B) and statistical calculations (C) are shown. Results are presented as individual values for each implantation and mean. (D, E) Placental measurements at gd12.5. Bar, 1 mm. (D) Representative ultrasound image of the single fetus, showing placental thickness, placental diameter, and placental area. (E) Statistical calculation of the measurements is shown. Results are presented as individual values for each placenta and mean. (F–I) Analysis of blood flow velocities at gd12.5. Bar, 1 mm. Representative CF (left) and PW (right) doppler images showing PSV and EDV of UA (F) and UmA (H). (G) Statistical calculation of UA resistance index (2 experimental repeats were combined). (I) Statistical calculation of UmA peak systolic velocities. (J–M) The pregnancy outcome of adoptive transferring NK cells in mice. Bar, 10 mm. (J) Representative pictures of fetuses from NK-cells transferred mice and control mice (PBS transferred) at gd16.5. (K) Statistics were calculated by the weight and length of the live fetus in different groups. (L) Representative pictures of the placenta correspond to the fetus in (J). (M) Statistics were calculated by the weight and diameter of the placenta. Data represent means ± SD. Data were analyzed by one-way ANOVA (C, E, G, I, K, M).

