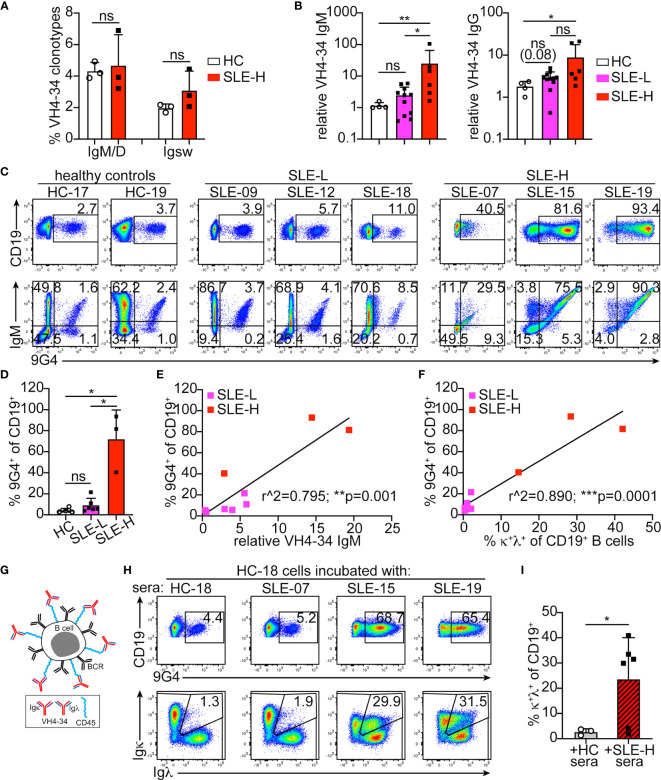
Figure 6.
Analysis of VH4-34 B cells and antibodies. (A) Frequency of VH4-34-bearing clonotypes among all unswitched (IgM/D) and switched (Igsw) clones obtained by 10X Genomics V(D)J sequencing in three healthy controls (HC) and three SLE-H subjects. (B) Relative titers of VH4-34 IgM (left) and VH4-34 IgG (right) in sera of healthy control (HC, N=4), SLE-L (N=11) and SLE-H (N=6) subjects. Titers are shown on logarithmic scale and relative to one of the HC samples. (C) Representative flow cytometric analyses of 9G4 (anti-VH4-34) staining vs CD19 (top) and IgM (bottom) on CD19+ gated B cells from healthy and SLE subjects. (D) Frequency of 9G4+ B cells measured by flow cytometry in healthy (N=6), SLE-L (N=6) and SLE-H (N=3) subjects over 4 independent experiments. (E, F) Scatter plot analyses of the percentage of 9G4+ B cells (y-axis) relative to either (on x-axis) VH4-34 IgM sera titers (E) or the frequency of κ+λ+ B cells (F) in SLE patients. N=9, 6 SLE-L and 3 SLE-H. Data were analyzed by simple linear regression. (G) Schematic modeling the decoration of B cells by VH4-34, κ or λ, antibodies. (H) Flow cytometric analyses of CD19 vs 9G4 (top), and Igκ vs Igλ (bottom), on CD19+ gated B cells from healthy control HC-18 that were incubated for 30 min at 4°C with undiluted sera from the same healthy subject or from three SLE-H individuals, as indicated. Data are from one of two independent experiments (data from second experiment are in Supplementary Figure S5D ). (I) Frequency of κ+λ+ cells measured by flow cytometry within the CD19+ B cell populations of HC PBMCs incubated with sera from either HC or SLE-H subjects. N=3 for HC cells+HC sera; N=6 for HC cells+SLE-H sera; analyzed over 2 independent experiments. In all bar graphs, each symbol is an individual, bars represent mean+SD, and statistical analyses were performed with Mann-Whitney U tests. *p ≤ 0.05; **p < 0.01; ***p < 0.001; ns, not significant.

