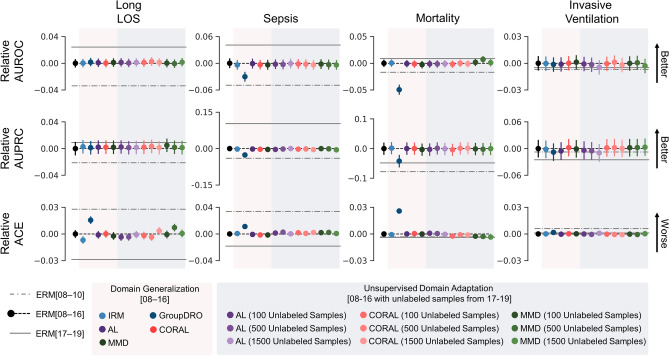
Figure 3.
Difference in mean performance of DG and UDA approaches relative to ERM[8–16] in the target year group (2017–2019). Performance of ERM[8–10] (train set 2008–2010 and test set 2017–2019, dashed line) and ERM[17–19] (train and test sets 2017–2019, solid line) models are also shown for comparison. Error bars indicate 95% confidence interval obtained from 10,000 bootstrap iterations. Here, we show results from three of the four experimental conditions using differing number of unlabelled samples for UDA—we did not observe meaningful differences across the number of unlabelled samples evaluated. Numerical representation of the performance measures relative to ERM[8–16] are presented in Supplementary Table S3. LOS: length of stay; ERM: empirical risk minimization; IRM: invariant risk minimization; AL: adversarial learning; GroupDRO: group distributionally robust optimization; CORAL: correlation alignment; MMD: maximum mean discrepancy; AUROC: area under the receiver operating characteristics curve; AUPRC: area under the precision recall curve; ACE: absolute calibration error; domain generalization: DG; unsupervised domain adaptation: UDA.

