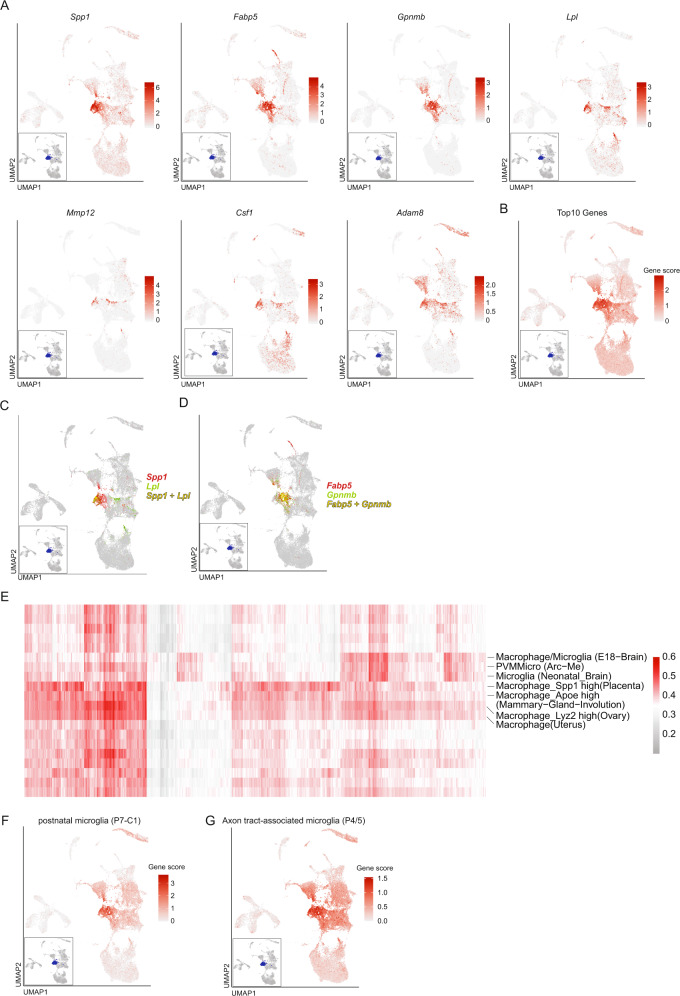
Fig. 3. The stroke-associated myeloid cell (SAMC) phenotype partially resembles early embryonic microglia and upregulates genes of lipid metabolism.
A Feature Plots of selected marker genes specifically enriched (Methods) in the SAMC cluster; termed stroke-associated myeloid cells in the text. B Gene score feature plot of the top 10 genes specifically expressed in the SAMC cluster at 24 h post-ischemia. C Dual color feature plot of Spp1 and Lpl. D Dual color feature plot of Fabp5 and Gpnmb. E All cells assigned to the SAMC cluster were submitted to the mouse cell atlas (MCA) and compared with public single-cell datasets. Each column represents one cell, each row represents one MCA reference cell type. Colors indicate Pearson correlation coefficient between the top MCA cell types and the submitted cells. Labeled are reference datasets with a high Pearson correlation across multiple cells. F Gene score feature plot using the Top25 marker genes of postnatal day 7 microglia cells (P7-C1) from39. G Gene score feature plot using the Top30 marker genes of axon tract-associated microglia cells (P4/5) from30.

