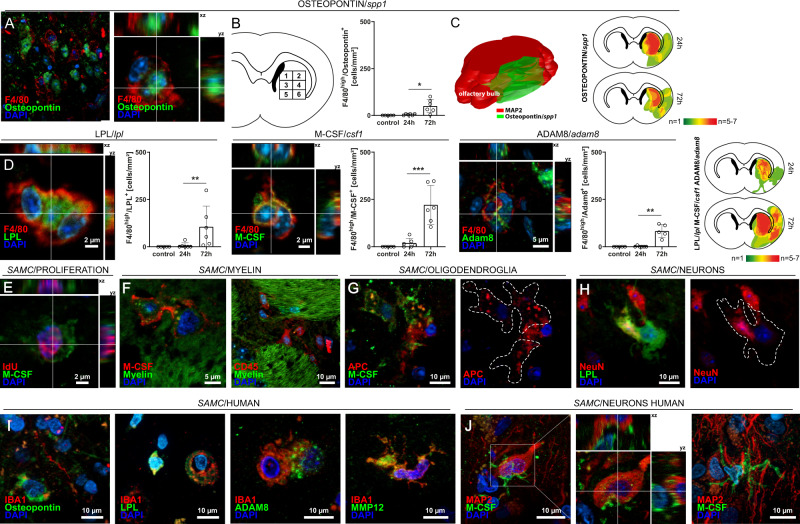
Fig. 4. Top markers of stroke-associated myeloid cells (SAMCs) are confirmed within infarcted brain parenchyma in rodents and human stroke patients.
A Middle cerebral artery occlusion (MCAO) was induced in C57BL/6 mice for 45 min. Coronal (approx. bregma 0–1 mm) and transversal cryosections were prepared of 24 and 72 hours post-MCAO brains and were co-stained for F4/80 and Osteopontin (Spp1). Overview images of the lesioned striatum (str) and the corpus callosum (cc) and corresponding z-stacks are shown. B The density of Osteopontin+-cells was quantified in eight defined regions 1–6 (covering most of the middle cerebral artery flow area at bregma, see numbered rectangles) generated from brains post 24 h (n = 6) and post 72 h (n = 5). Data are presented as mean values ± SEM (two-sided t-test, *p = 0.0106). C Heatmaps were generated from brains post 24 h (n = 6) and post 72 h (n = 5) (two-sided t-test, *p < 0.05). 3D heatmap of Osteopontin expression was constructed by combining nine consecutive transversal sections of 72 h post-MCAO brains (n = 3) using Free-D software. Neuronal-marker MAP2 was used to define lesion borders. D Sections of 24 h and 72 h post-MCAO brains as in A were co-stained for F4/80 together with LPL, M-CSF, and ADAM8. Representative Z-stacks are shown. The density of positive cells was quantified within the defined sections 1–6 of 24 h (n = 6) and 72 h (n = 4) post-MCAO brains. Plots in B and D are representative of n = 4 stainings (sham), n = 6 stainings (24 h post MCAO) and n = 4 stainings (72 h) (two-sided t-test, **p < 0,01, ***p < 0.001; LPL/F4/80: p = 0.0087; M-CSF/F4/80: p = 0.0008; ADAM8/F4/80: p = 0.0043). Data are presented as mean values ± SEM. E Mice (n = 3) were injected with idoxuridine (IdU) twice 48 h and 24 h prior to induction of MCAO and IdU was co-stained with M-CSF. F Sections as in A were co-stained with FluoroMylein and SAMC-marker M-CSF, showing potential myelin phagocyting by CD45- and M-CSF-expressing cells. G M-CSF-expressing cells potentially phagocyting APC+-oligodendroglia. H LPL+-cell enclosing a NeuN+-neuron within the lesioned striatum. I Representative immunofluorescence images and corresponding z-stacks of SAMC-marker Osteopontin, LPL, M-CSF, Adam8, and MMP12 co-stained with microglial/monocyte marker IBA1 within the infarcted tissue of stroke patients (representative images of n = 5 patients). J Human stroke sections stained for SAMC-marker M-CSF and neuronal-marker MAP2 showing potential neuronal phagocyting by M-CSF+ cells. Source data for B and D are provided as a Source Data file.

